Hyperparameter Optimization
Hyperparameter optimization (hyperopt) automatically finds the best parameter values for your trading strategy. Instead of manually testing different RSI periods, stop-loss levels, or entry thresholds, hyperopt systematically searches through thousands of combinations to find the optimal configuration for your chosen objective — Sharpe ratio, drawdown control, or pure profit.
What Hyperopt Does
Every strategy has parameters that influence its behavior: indicator periods, entry/exit thresholds, stop-loss percentages, ROI targets. Finding the right combination by hand is tedious and often leads to suboptimal results.
Hyperopt solves this by:
- Taking your defined parameter ranges (e.g., RSI period: 5–50)
- Intelligently sampling combinations across thousands of iterations (epochs)
- Evaluating each combination against historical OHLCV data
- Converging on the parameter set that best optimizes your chosen loss function
The result is a data-driven parameter configuration rather than a guess — but only if you set it up correctly. Hyperopt is also the easiest way to overfit a strategy to historical noise, so the workflow you use matters more than the search itself.
How Hyperopt Works
- Define Parameters — mark strategy parameters for optimization in the Strategy Studio (e.g., RSI period 5–50, entry threshold 10–40)
- Configure Search — choose epochs (iterations), optimization spaces, and loss function
- Run Optimization — VolatiCloud executes Freqtrade hyperopt on your selected runner
- Review Results — examine best parameters, epoch-by-epoch results, and performance metrics
Setting Up Optimizable Parameters
In the Strategy Studio, each numeric parameter (indicator periods, condition thresholds) has an Optimize toggle:
- Indicator parameters: click the toggle next to Period, Threshold, etc.
- Condition thresholds: toggle optimization on constant values in entry/exit conditions
- Min/Max range: define the search bounds for each parameter
- Space: assign parameters to optimization spaces (Buy Signal, Sell Signal, etc.)
Keep your parameter ranges focused. A wider range means more combinations to test and longer optimization times. Start with a range that makes practical sense for the indicator (e.g., RSI period 5–50 rather than 1–500).
Running a Hyperopt
Step 1: Navigate
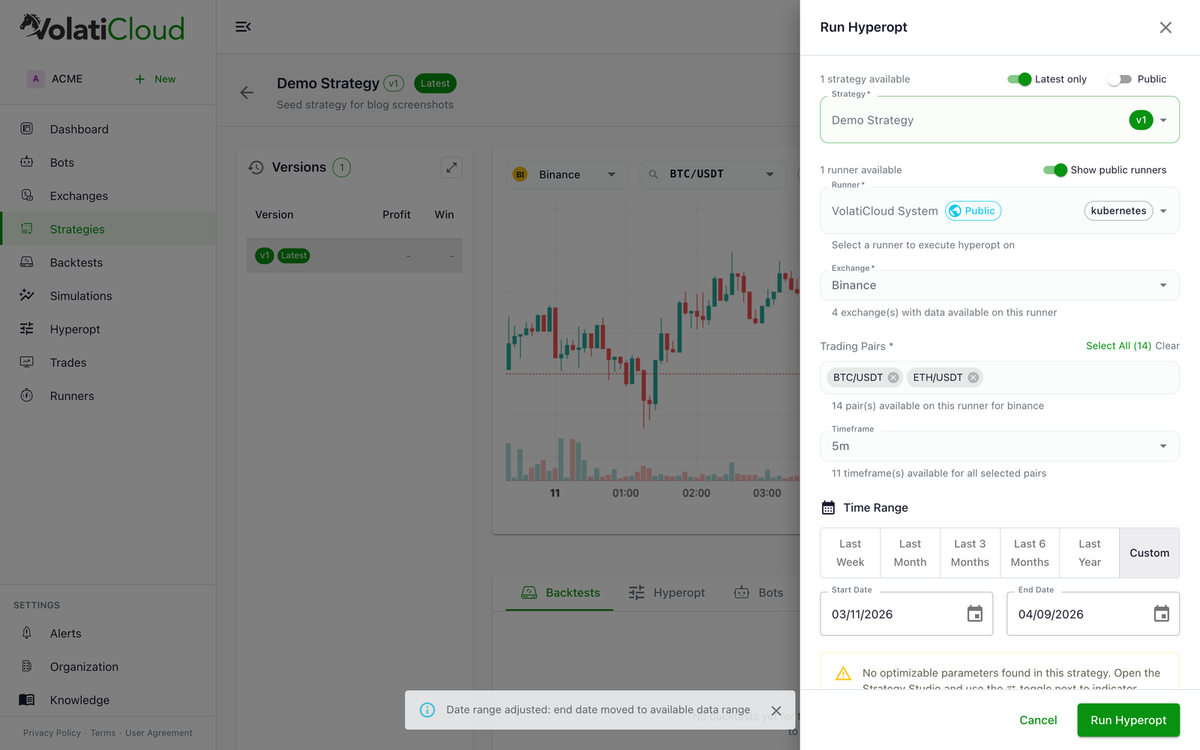
Go to the Hyperopt page from the sidebar, or click Run Hyperopt from a strategy's detail page.
Step 2: Select Strategy and Runner
Choose the strategy you want to optimize and the runner that will execute the hyperopt job.
Step 3: Configure Exchange Settings
Select the exchange, trading pair(s), and timeframe. Set the date range for the historical data used during optimization. Reserve the most recent 20–30% of available data as a holdout for out-of-sample validation — do not include it in the hyperopt window.
Step 4: Set Hyperopt Parameters
| Parameter | Description | Recommendation |
|---|---|---|
| Epochs | Number of iterations to run | Start with 50–100, increase to 500+ for production |
| Loss Function | Objective to optimize | Sharpe Ratio for balanced results |
| Spaces | Which parameter groups to optimize | Start with Buy Signal and Sell Signal |
Step 5: Run
Click Run Hyperopt. You can monitor progress in real time (see Real-Time Monitoring below).
Loss Functions — What Each One Optimizes
The loss function determines what hyperopt is trying to optimize. Each function emphasizes different aspects of strategy performance.
| Loss Function | Optimizes for | Best when |
|---|---|---|
| Sharpe Ratio | Risk-adjusted returns | You want balanced risk/reward (recommended default) |
| Sortino Ratio | Downside risk-adjusted returns | You care more about avoiding losses than capturing gains |
| Calmar Ratio | Returns relative to max drawdown | Drawdown control is your top priority |
| Max Drawdown | Minimizing maximum drawdown | You need strict capital preservation |
| Profit/Drawdown | Balance between profit and drawdown | You want profit but with drawdown guardrails |
| Only Profit | Maximum total profit | You're optimizing purely for returns (highest overfitting risk) |
Only Profit is the most prone to overfitting. It tends to find parameters that exploit specific historical patterns rather than robust trading signals. Always validate results with an out-of-sample backtest.
Optimization Spaces
Spaces define which groups of parameters hyperopt will search. You can enable one or more:
| Space | What it optimizes |
|---|---|
| Buy Signal | Entry condition thresholds and indicator parameters |
| Sell Signal | Exit condition thresholds and indicator parameters |
| ROI | Return-on-investment table (time-based profit targets) |
| Stoploss | Stop-loss percentage |
| Trailing | Trailing stop-loss parameters |
Optimizing all spaces simultaneously increases the search space exponentially. Start with Buy Signal and Sell Signal, then optimize ROI and Stoploss separately with the best signal parameters applied. This staged approach also makes it easier to attribute performance changes to specific parameter groups.
Understanding Results
Overview
After the hyperopt completes, the overview panel shows:
- Best Epoch — the epoch number that produced the optimal result
- Best Loss — the objective value achieved (lower is better for most loss functions)
- Best Parameters — the parameter values from the winning epoch
- Total Trades — number of trades in the best epoch's backtest
- Profit — total profit from the best parameter set
- Max Drawdown — maximum peak-to-trough decline with the best parameters
Epoch Results
The Epochs tab displays a sortable table of all completed epochs:
| Column | Description |
|---|---|
| Epoch | Iteration number |
| Loss | Objective value (lower is better for most loss functions) |
| Trades | Number of trades executed |
| Win Rate | Percentage of profitable trades |
| Profit | Total profit/loss |
| Max Drawdown | Maximum peak-to-trough decline |
| Sharpe Ratio | Risk-adjusted performance metric |
Sort by any column to find the best-performing parameter sets. The top result (lowest loss) is highlighted automatically.
Applying Results
Once you've identified the best parameters, you can apply them to your strategy directly from the results page. This updates the strategy's parameter values in the Strategy Studio without changing the strategy logic — a new immutable strategy version is created so the previous configuration is preserved.
Real-Time Monitoring
While a hyperopt is running, you can track its progress:
- Progress bar — shows optimization progress as a percentage, updated approximately every 30 seconds
- Epoch table — live-updating table that populates as each epoch completes
- Live logs — stream container logs in real-time to diagnose issues or monitor execution
Best Practices for Crypto Hyperopt
Getting Good Results
-
Start small, then scale. Run 50–100 epochs first to verify the setup works and parameters are being searched correctly. Then increase to 500+ for a thorough optimization.
-
Use out-of-sample validation. Split your historical data into two periods. Optimize on the first (in-sample) and validate with a standard backtest on the second (out-of-sample). If out-of-sample performance drops significantly, the parameters are likely overfit. The walk-forward optimization guide formalizes this into a repeatable procedure.
-
Keep the search space focused. More optimizable parameters does not mean a better strategy. Each additional parameter exponentially increases the search space. Optimize only the parameters that meaningfully affect performance.
-
Compare loss functions. Run the same hyperopt with different loss functions. If results vary wildly between Sharpe Ratio and Only Profit, the strategy may be fragile.
-
Check trade count. A parameter set that produces only 5 trades over a year is not statistically meaningful, even if those 5 trades were profitable. Ensure the optimized strategy makes enough trades for confidence (see analyzing backtest results).
Avoiding Overfitting
Overfitting is the biggest risk in hyperparameter optimization. An overfit strategy performs brilliantly on historical data but poorly in live trading.
- Fewer parameters is better. Every optimizable parameter is a degree of freedom that can latch onto noise rather than signal.
- Wider date ranges help. Optimize across varied market conditions (trending, ranging, volatile, calm) to find robust parameters.
- Sanity-check the results. If the optimal RSI period is 47 and the optimal threshold is 31.7, ask whether those values make practical trading sense. Round numbers and conventional ranges are often more robust.
- Validate with Monte Carlo. After optimizing, run a Monte Carlo simulation on the backtest results to stress-test the parameter set's robustness across thousands of randomized trade orderings.
- Walk it forward. Walk-forward optimization is the gold standard — train on a rolling window, test only on data the optimizer never saw, and check parameter stability across windows.
The avoiding overfitting in crypto backtests guide covers the full set of techniques.
Plan Requirements
Hyperparameter optimization is available on Pro and Enterprise plans.
| Pro | Enterprise | |
|---|---|---|
| Access | Full | Full |
| Max concurrent hyperopts | 2 | 5 |
| Max epochs per run | 1,000 | 10,000 |
Starter plan users can upgrade to Pro to access hyperparameter optimization. See Plans & Pricing for details.
Common Issues
"No hyperopt parameters found"
Ensure you have marked at least one parameter for optimization in the Strategy Studio using the Optimize toggle. Each optimizable parameter needs a defined min/max range.
Long running times
- Reduce the number of epochs
- Narrow parameter ranges to shrink the search space
- Select fewer trading pairs
- Optimize fewer spaces simultaneously
Poor or inconsistent results
- Try a different loss function — Sharpe Ratio is the most balanced default
- Ensure the date range includes enough historical data (at least 6 months recommended)
- Verify the date range covers varied market conditions, not just a single trend
- Increase epochs — the optimizer may not have converged with too few iterations
Results don't transfer to live trading
This is typically a sign of overfitting. See Avoiding Overfitting above. The most common remedies are reducing the number of optimized parameters and validating with out-of-sample data via walk-forward optimization.
Next Steps
- Running a Backtest — validate optimized parameters with an out-of-sample backtest
- Monte Carlo Simulation — stress-test optimized results with randomized trade permutations
- Walk-Forward Optimization — the structured workflow that catches in-sample overfitting
- Plans & Pricing — upgrade to Pro for hyperopt access