Backtesting
Backtesting simulates how your trading strategy would have performed against historical OHLCV data. It's the single most important step before deploying any strategy live — and the place where most strategies that look good on paper get caught before they cost you real capital.
VolatiCloud's backtesting engine runs your strategy candle-by-candle against years of cached historical data, producing a full trade log, equity curve, and 20+ performance metrics in seconds.
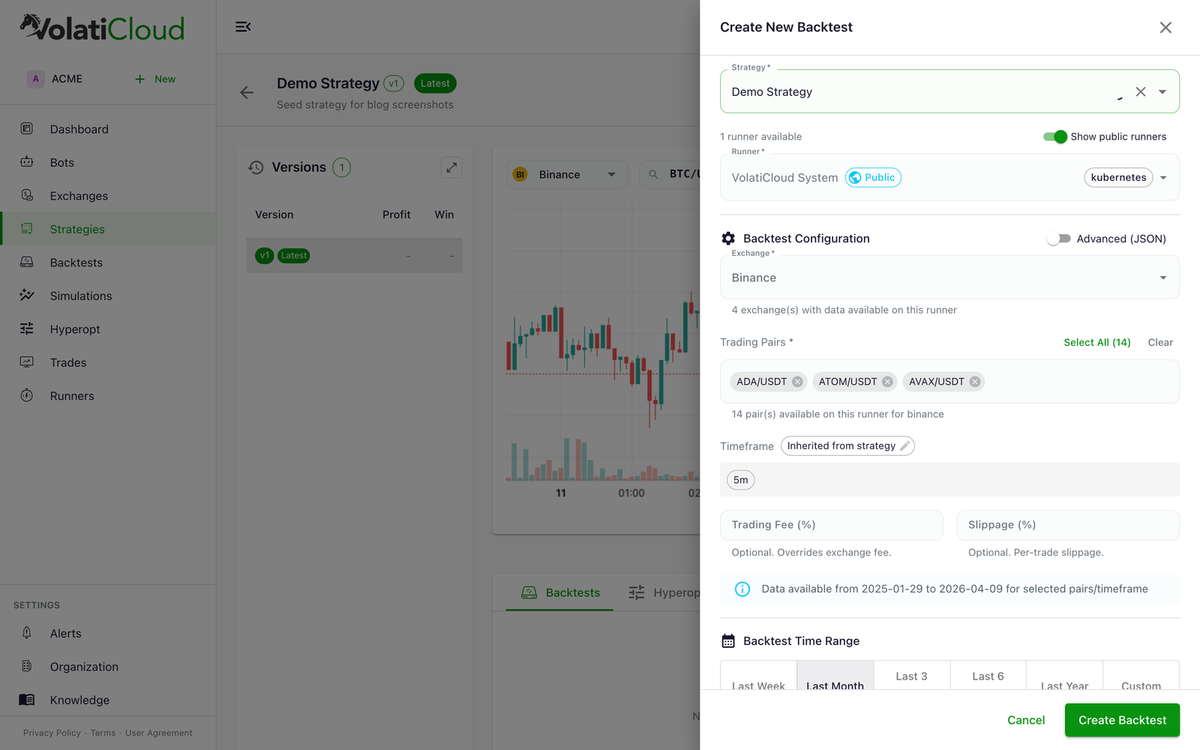
Everything on this page runs on VolatiCloud's infrastructure — no Freqtrade install, VPS, or data pipeline to maintain. For a feature-level tour of the backtesting engine and the metrics it reports, see backtesting on volaticloud.com.
Why Backtest Crypto Strategies?
- Validate the strategy — measure whether the entry/exit logic would have been profitable
- Quantify risk — compute drawdown, loss rate, and worst-period performance before any capital is at stake
- Compare versions — see how parameter changes or new conditions affect performance across immutable strategy versions
- Build deployment confidence — know your strategy has a measurable edge before risking real money
Past performance does not guarantee future results. Backtesting has inherent limitations including look-ahead bias, slippage assumptions, and changing market conditions. See the avoiding overfitting guide for the most common ways backtests mislead.
How Crypto Backtesting Works
VolatiCloud backtesting is powered by Freqtrade's battle-tested backtesting engine:
- Historical OHLCV data is fetched (or pulled from cache) for your chosen exchange, pair, and timeframe
- Your strategy runs against this data candle by candle
- Trades are simulated with realistic entry/exit prices, fees, and slippage assumptions
- Results are calculated and displayed with comprehensive metrics
All backtests run in dry-run mode — no real trades are ever placed during backtesting. The only thing consumed is compute time on the runner you assign.
Backtest vs Live Trading
| Aspect | Backtest | Live |
|---|---|---|
| Data | Historical OHLCV | Real-time |
| Orders | Simulated | Real exchange orders |
| Slippage | Approximated | Actual market conditions |
| Risk | None | Real money at stake |
| Speed | Instant (years of data per minute) | Real-time |
Key Backtest Metrics
Profitability metrics
| Metric | What it means | Target |
|---|---|---|
| Total Profit % | Overall return over the period | Positive |
| Average Profit per Trade | Mean profit per closed trade | >0 |
| Best Trade | Best single trade return | — |
| Worst Trade | Worst single trade return | Limited loss |
Risk metrics
| Metric | What it means | Target |
|---|---|---|
| Max Drawdown | Largest peak-to-trough decline | <20% |
| Daily Loss Limit | Worst single day loss | Limited |
Quality metrics (risk-adjusted return)
| Metric | What it means | Target |
|---|---|---|
| Win Rate | % of profitable trades | >50% (mean reversion); 35–50% (trend-following) |
| Profit Factor | Gross profit ÷ gross loss | >1.5 |
| Expectancy | Average expected return per trade | >0 |
| Sharpe Ratio | Return ÷ total volatility | >1.0 |
| Sortino Ratio | Return ÷ downside volatility | >1.5 |
| Calmar Ratio | Return ÷ max drawdown | >1.0 |
Activity metrics
| Metric | What it means |
|---|---|
| Total Trades | Number of trades opened/closed |
| Avg Trade Duration | How long trades are held |
| Backtest Period | Date range covered |
A full breakdown of how to interpret each of these metrics lives in analyzing backtest results.
Backtest Status Lifecycle
| Status | Description |
|---|---|
pending | Backtest queued, waiting for runner |
running | Backtest in progress on the assigned runner |
completed | Backtest finished successfully — results available |
failed | Backtest encountered an error (see error message in detail view) |
cancelled | Backtest was manually cancelled before completion |
Status updates stream in real time over GraphQL WebSocket subscriptions, so the UI reflects progress without page refreshes.
Common Pitfalls to Avoid
- Backtesting on too short a window. Always use at least 12 months of data; ideally 2–3 years covering multiple market regimes (bull, bear, sideways).
- Overfitting to a single time period. A strategy that works perfectly on one window often fails out-of-sample. See the avoiding overfitting guide and walk-forward optimization for prevention techniques.
- Ignoring trade count. Fewer than 30 trades makes any metric statistically unreliable. Extend the date range or add more pairs.
- Skipping out-of-sample validation. Always reserve 20–30% of your data for a holdout test the optimizer never sees.
Next Steps
- Running a Backtest — step-by-step guide
- Analyzing Results — interpret your metrics
- Hyperparameter Optimization — automatically tune strategy parameters
- Monte Carlo Simulation — stress-test your trade log against thousands of randomized orderings
Learn More
- Blog: Crypto Backtesting Deep Dive — candle-by-candle simulation, metrics, and common pitfalls.
- Blog: Avoiding Overfitting in Crypto Backtests — techniques to build strategies that generalize beyond historical data.
- Blog: Walk-Forward Optimization — the only optimization workflow that survives live trading.