The Overfit-Risk Score: Proving a Backtest Holds Up Out-of-Sample

A backtest that only shows in-sample performance is a strategy that hasn't been tested yet — it's been fitted. The gap between "looks great on the data I optimized against" and "still works on data it never saw" is where most algorithmic strategies quietly die. VolatiCloud's backtest detail page now scores that gap directly: a 0-100 overfit-risk score, a Low/Moderate/High band, and the specific factors that produced it, computed automatically whenever you run an out-of-sample split or a 3-window consistency check.
This is a new card on the backtest detail page, not a new backtest engine — VolatiCloud already ran in-sample/out-of-sample splits under the hood. What changed is that the gap between those two runs is now measured, scored, and explained instead of left for you to eyeball across two tabs.
Why "Looks Good In-Sample" Isn't Good Enough
Every optimizer will find parameters that fit historical data well — that's what it's designed to do. The question a backtest alone can't answer is whether those parameters captured a real, repeatable edge or just noise in a specific date range. Research on retail algorithmic strategies consistently finds that a large majority of strategies that look profitable in-sample fail to hold up on data the optimizer never touched.
The standard defense is an out-of-sample split: hold back a slice of history, optimize (or just validate) on the rest, then check performance on the untouched slice. VolatiCloud has supported this for a while — see Avoiding Overfitting in Crypto Backtests and Walk-Forward Optimization for Crypto Strategies for the underlying methodology. The gap those posts describe — comparing Sharpe, profit factor, and win rate between the in-sample and out-of-sample legs by hand — is exactly what the new Overfit Risk card automates.
What the Overfit Risk Card Shows
Run a backtest with Out-of-sample split or 3-window consistency check selected as the validation mode, and an Overfit Risk card appears at the top of the backtest's Overview tab, above the metric wall.
The card never shows a bare number. Underneath the 0-100 score and its band chip (green Low, amber Moderate, red High), the primary driving factor is always visible — something like "Sharpe fell 1.8 → 0.3 out-of-sample" or "only 12 out-of-sample trades — confidence is limited." Hover the factor for the complete list.
The score weights four metrics by how much each one degraded between the in-sample and out-of-sample legs:
| Metric | Weight | Why it matters |
|---|---|---|
| Sharpe ratio | 40% | Risk-adjusted return is the hardest thing to fake with curve-fitting |
| Total profit | 30% | Raw degradation in the number you actually care about |
| Profit factor | 20% | Whether wins still meaningfully outweigh losses |
| Win rate | 10% | The most curve-fit-prone metric on its own, so it's weighted lightest |
Bands: Low is a score under 25 (out-of-sample performance held up), Moderate is 25–60 (some degradation or a thinner sample than ideal), High is over 60 (either the strategy fell apart out-of-sample, there weren't enough out-of-sample trades to trust the result, or both).
A losing in-sample leg is floored at Moderate, never Low — if the strategy had no edge to begin with, there is nothing to overfit, and a reassuring "Low" badge would misrepresent it. A losing out-of-sample leg also cannot present as Low, but that falls out of the degradation maths rather than the floor. Either way: if you see a low score, it earned it.
The 3-Window Consistency Check
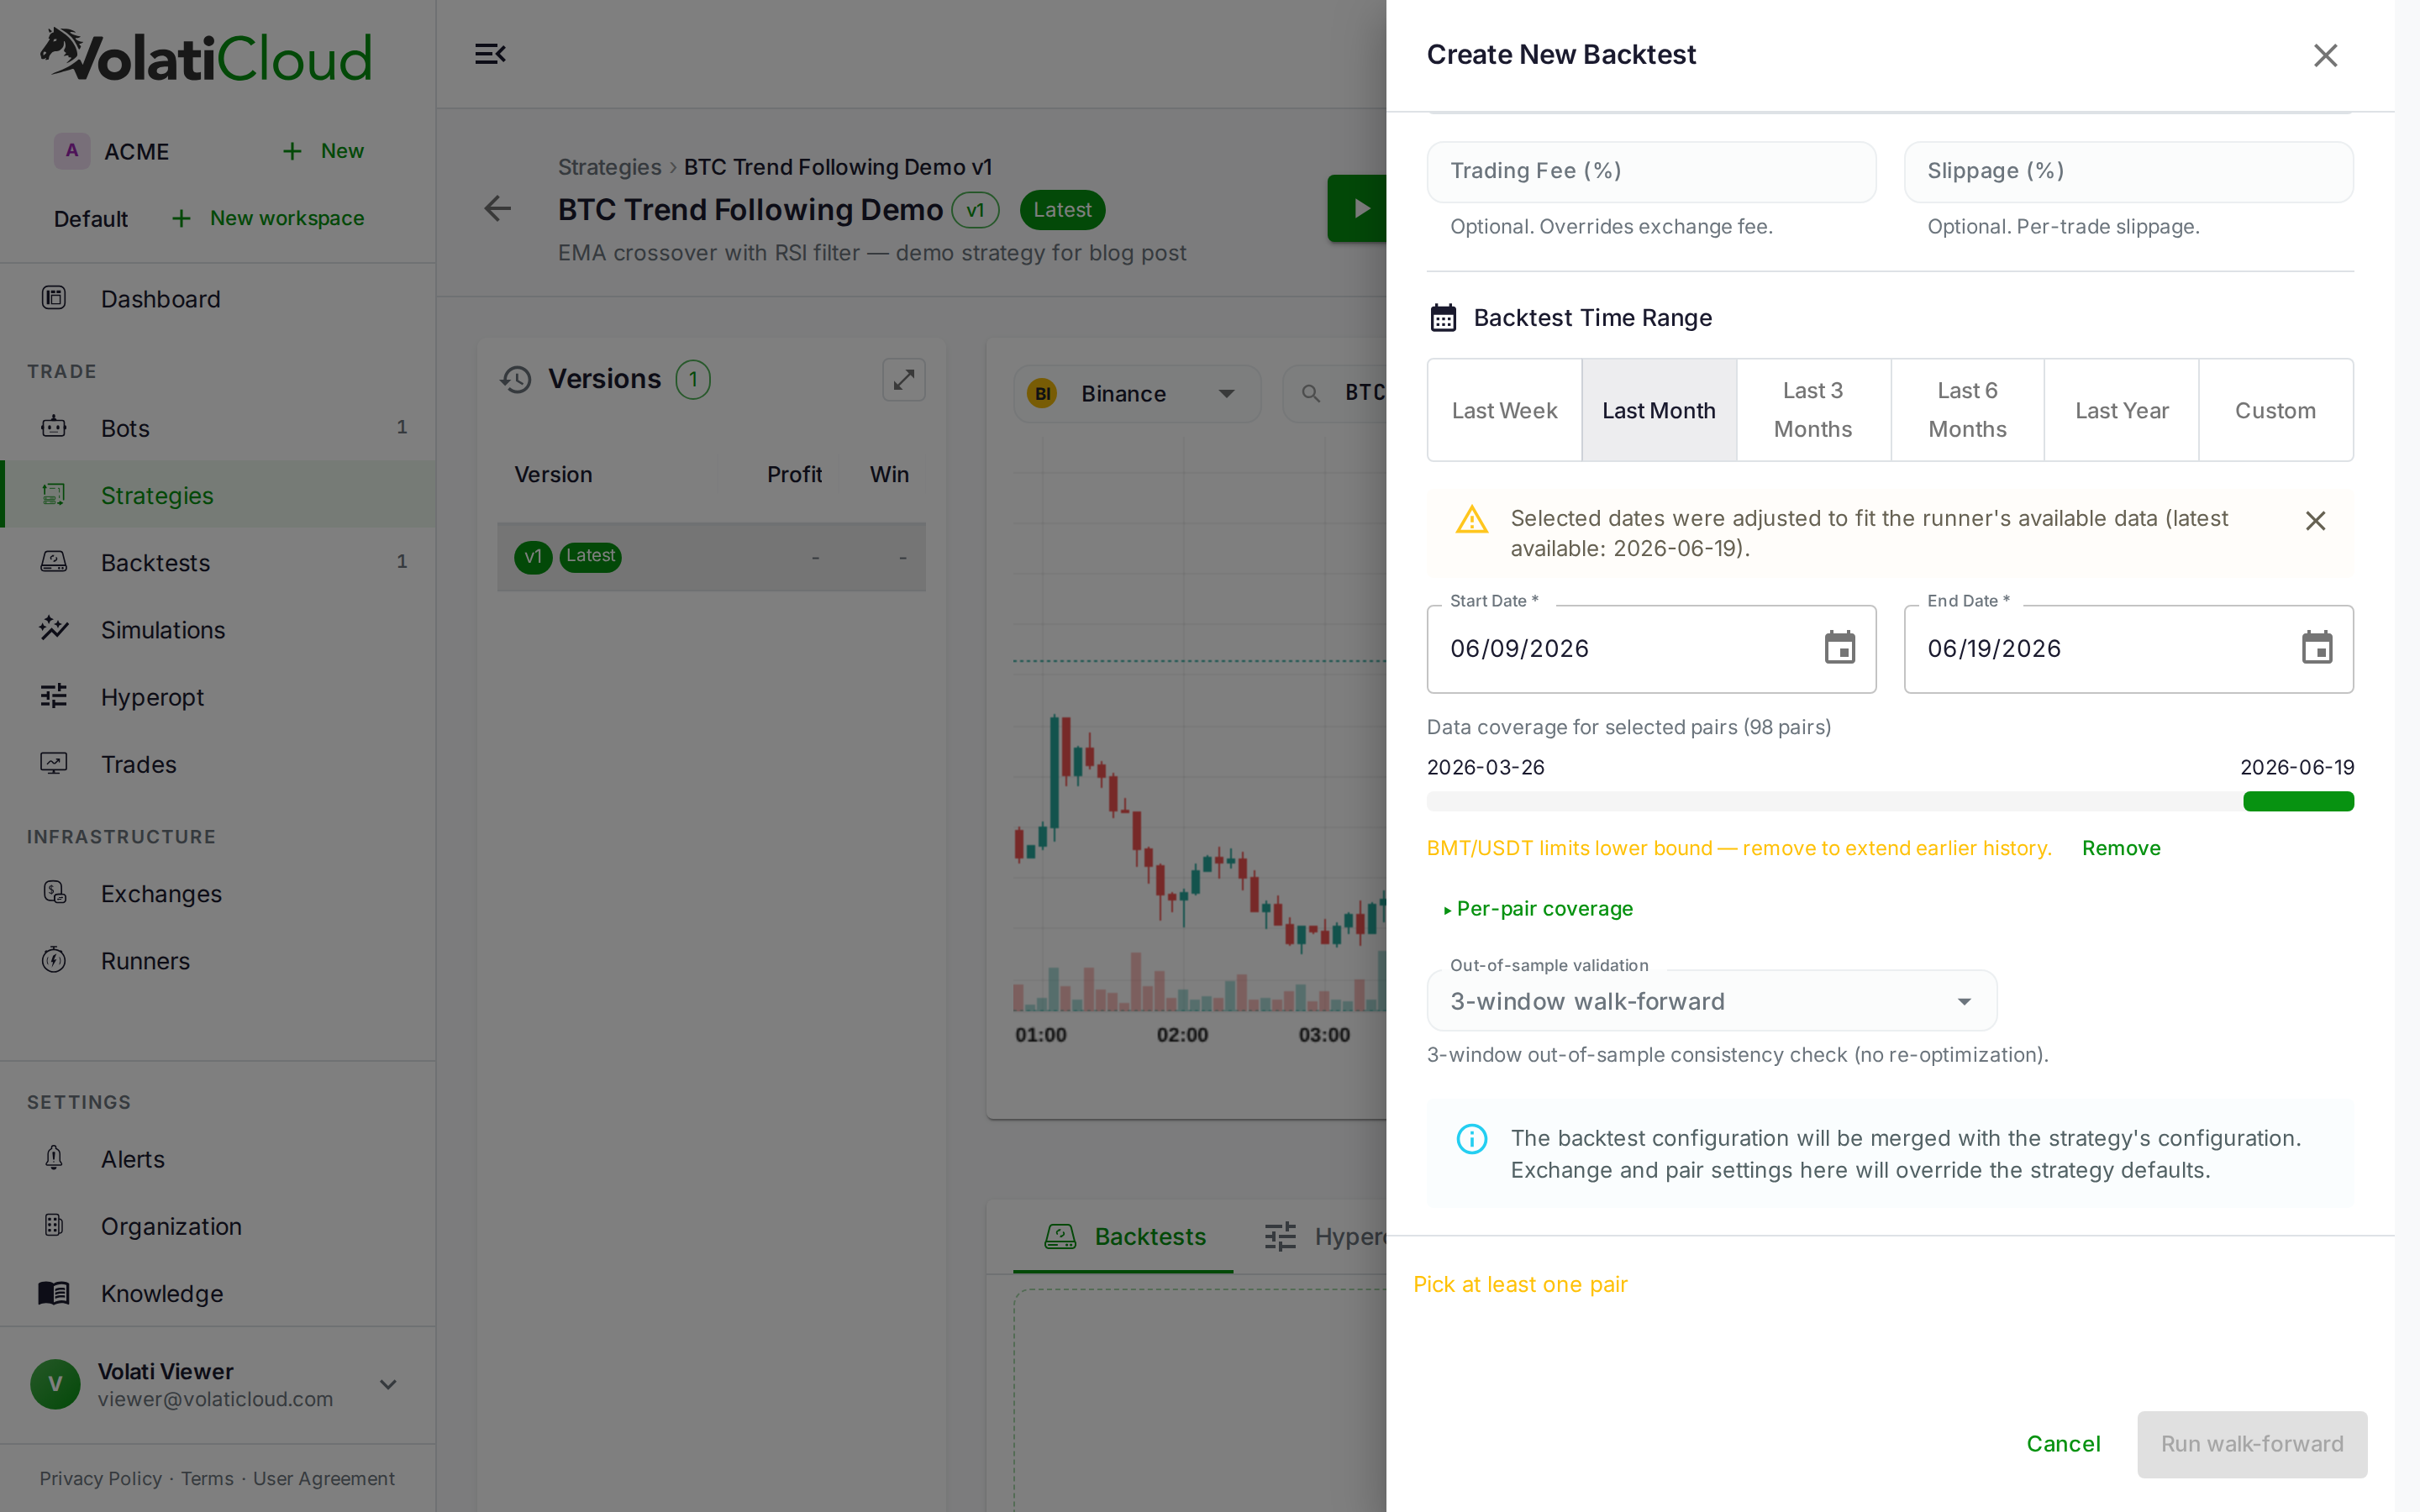
A single in-sample/out-of-sample split answers one question about one boundary in time. The new 3-window consistency check runs the same, fixed strategy — no re-optimization — across three anchored, expanding windows, each testing on a period the prior windows never saw.
Window 1: train [-------]  test [==]
Window 2: train [-----------]  test [==]
Window 3: train [---------------]  test [==]
This is a consistency check, not the re-optimize-every-window workflow described in the Walk-Forward Optimization post — no parameters change between windows. It answers a narrower, more direct question: does this exact strategy configuration perform consistently across different slices of history, or does it only work in one? The overfit-risk score for a consistency check is based on the consistency of results across the three windows rather than a single IS-vs-OOS delta.
Real walk-forward optimisation, which re-optimises the parameters on each training window before testing the next one, is not in VolatiCloud yet and comes later. Until then, the consistency check tells you whether one fixed configuration holds up across time; it does not search for new parameters.
Below the score card, the In-sample vs out-of-sample panel (or the per-window strip, for consistency checks) breaks out each metric side by side so you can see exactly which one moved and by how much — without doing the comparison yourself across two backtest tabs.
An Advisory Warning, Not a Gate
The score is deliberately advisory. It doesn't block a backtest from being viewed, published, or used to launch a bot — VolatiCloud isn't in a position to know every valid reason a strategy might score High (thin markets, a genuinely short-lived edge, deliberately narrow test windows). What it does do is make the risk impossible to miss at the moment it matters most: when you deploy to a live bot.
If the strategy's most recent validated backtest scored High risk, the bot creation flow shows a prominent warning — the score, the fact that out-of-sample validation didn't hold up, and a nudge to re-test before risking capital. It's a warning banner, not a hard stop; you can still proceed if you've judged the risk acceptable.
It Follows the Strategy to the Public Embed
If you publish a bot or backtest publicly, the overfit-risk band travels with it — the embed's metric tile shows the score and band the same way the detail page does, without leaking any dollar figures. If you're sharing a strategy's track record, the audience gets an honest, verifiable signal of whether that track record is likely to repeat, not just the headline return.
Getting a Score on Your Own Backtests
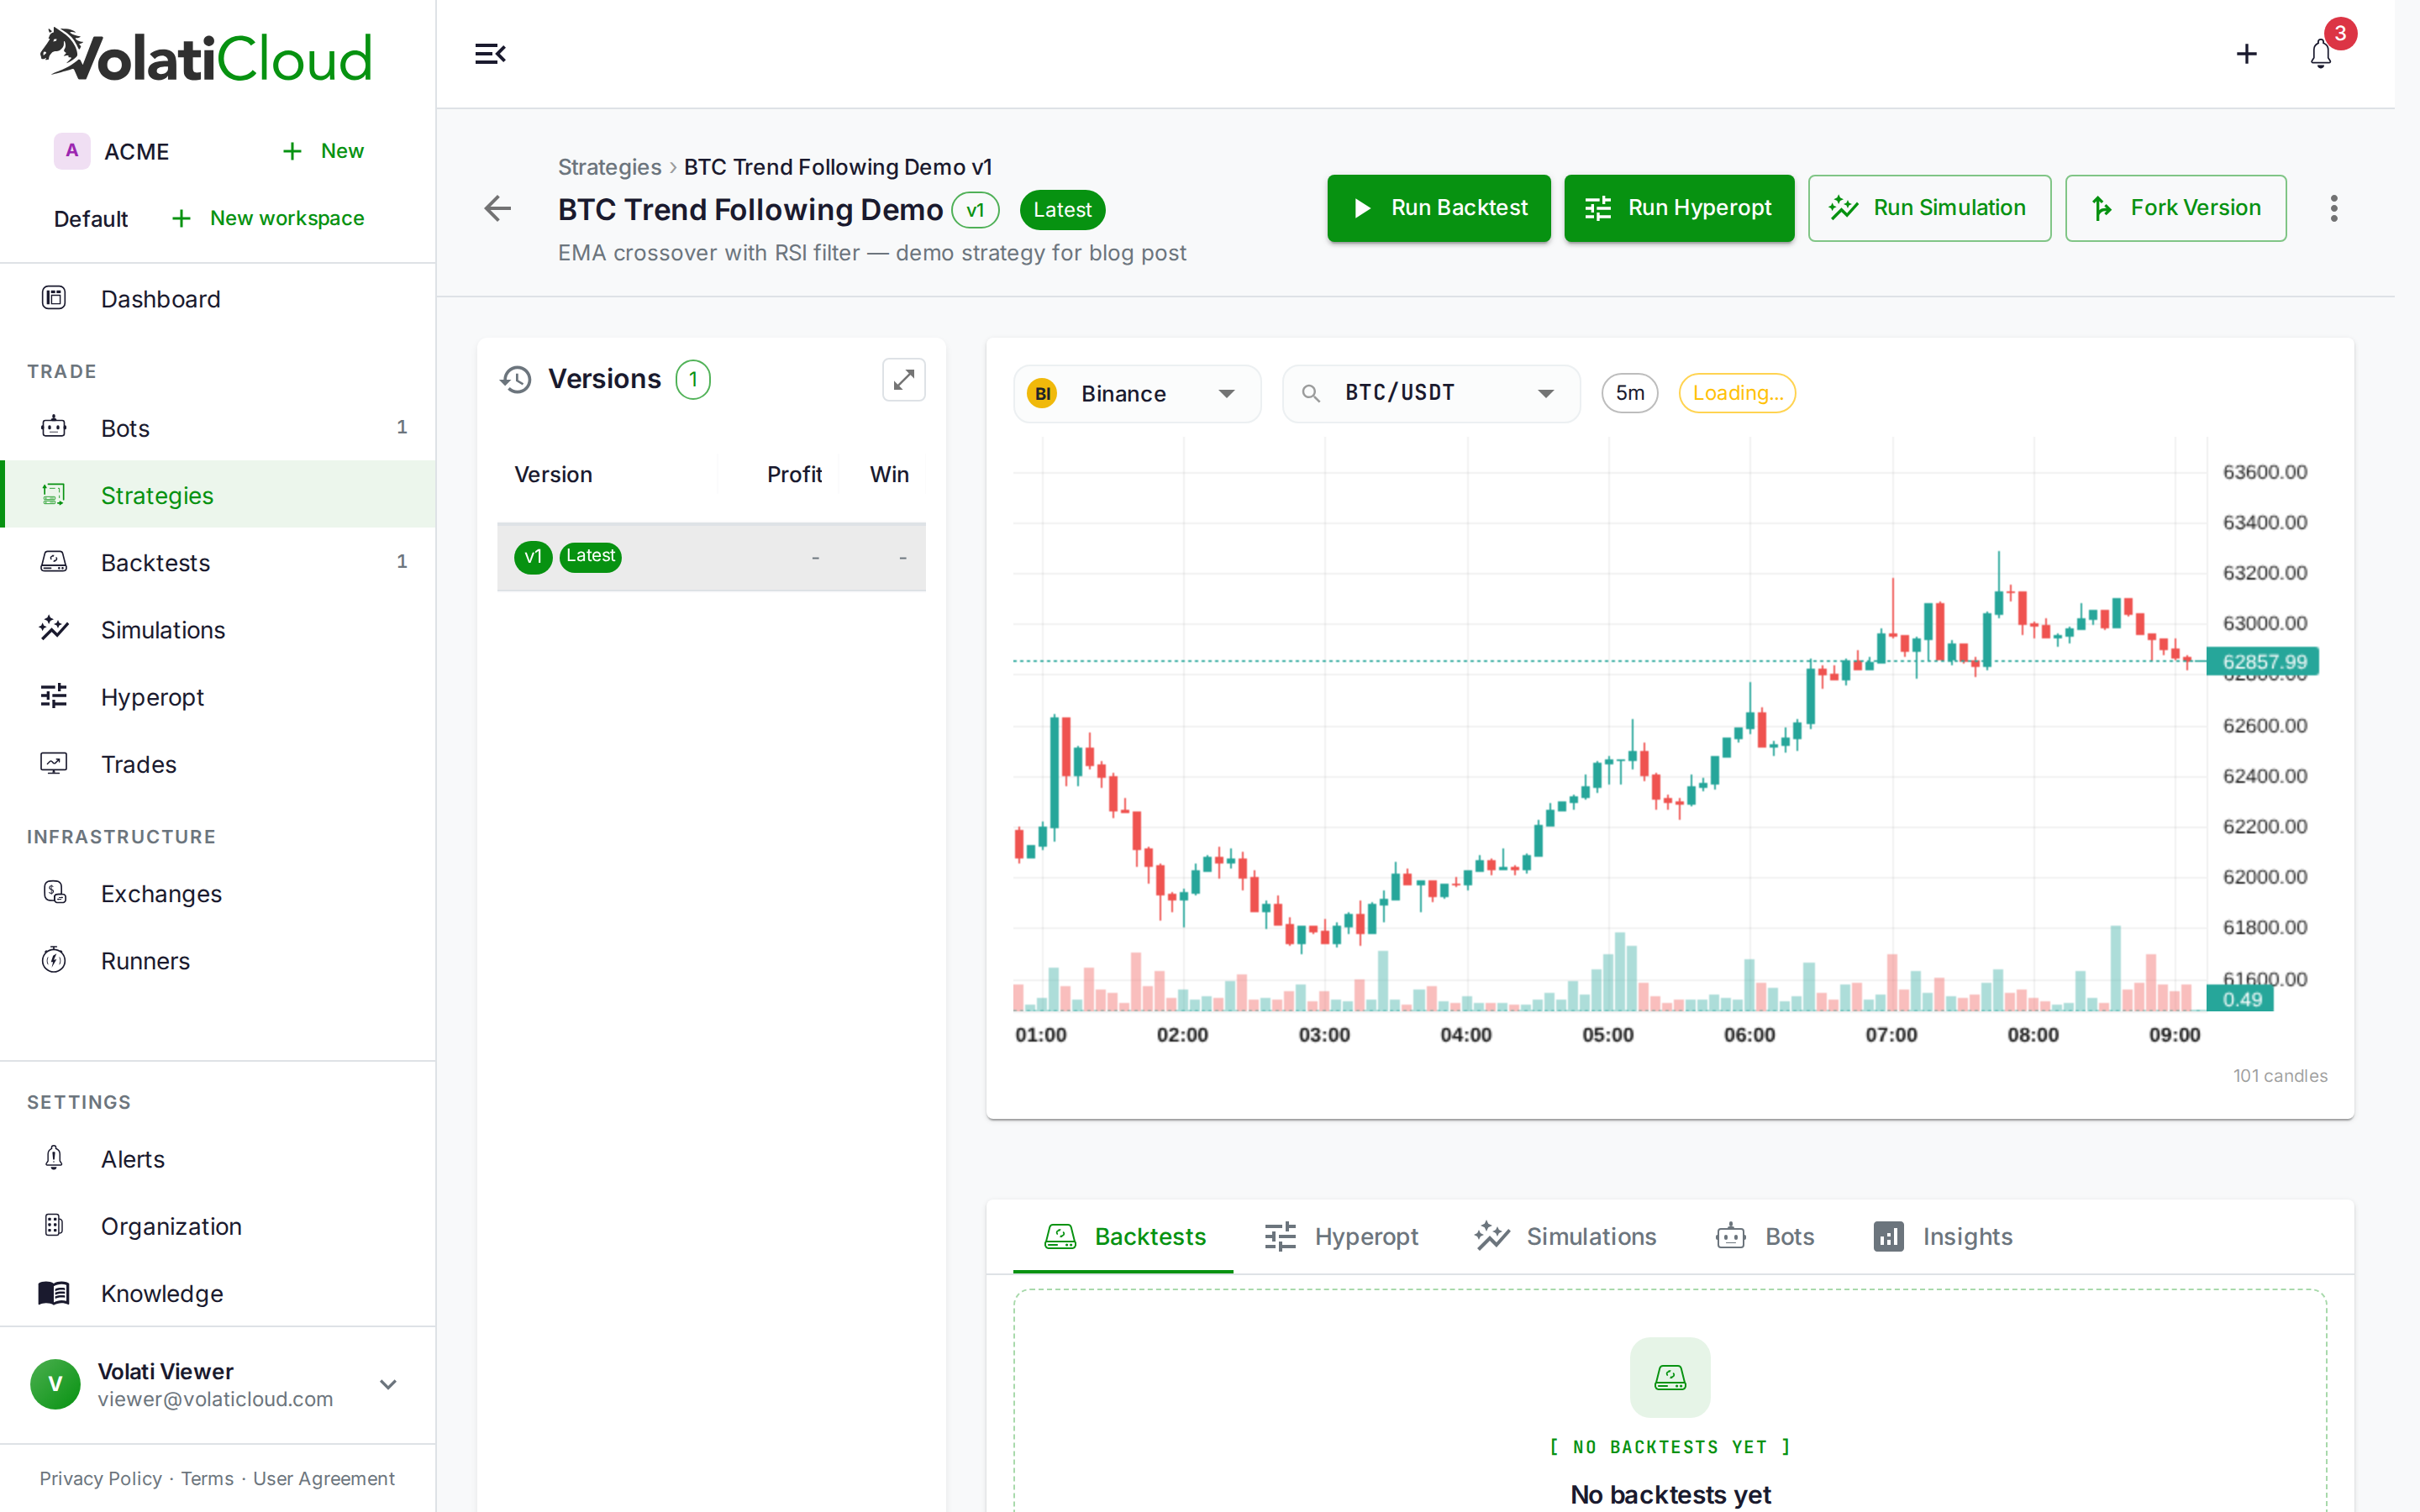
- Open a strategy and click Run Backtest in the toolbar (or Backtests → New Backtest).
- Under out-of-sample validation, choose Out-of-sample split for a quick check or 3-window consistency check for a stronger read.
- Run the backtest. Once complete, the Overfit Risk card appears on the detail page automatically — no separate step.
- Read the primary factor first. If it's a metric degradation, ask whether that degradation is explainable (a regime shift in the held-out period) or a sign of curve-fitting. If it's a low-trade-count warning, the fix is usually a longer date range, not a different strategy.
Pairing this with the broader reading habits from How to Read a Backtest and the sample-size floor from How Many Trades Does Your Backtest Need? gives you a fairly complete pre-deployment checklist: enough trades, metrics that hold up out-of-sample, and now a single score that tells you at a glance whether the first two conditions were actually met.
Run a split or a consistency check on your next backtest in the VolatiCloud console and see what your strategy's overfit-risk score actually says before you fund it with real capital.