Williams %R Strategy: Fast Reversal Signals for Crypto Bots

Most momentum oscillators tell you the same story with a different scale. Williams %R tells it upside down — literally. Instead of climbing from 0 to 100 as price strengthens, it falls from 0 to -100, and that inversion trips up more traders than it should. Once the scale clicks, though, Williams %R is one of the fastest-reacting overbought/oversold tools available, and it slots directly into VolatiCloud's Strategy Builder as a native indicator node.
What Williams %R Measures
Developed by Larry Williams, the indicator compares the current close to the high-low range over a lookback period — the same core idea behind the Stochastic Oscillator, just inverted and rescaled:
%R = ((Highest High − Close) / (Highest High − Lowest Low)) × -100
Highest High and Lowest Low are taken over the lookback window (default: 14 periods). The output always falls between 0 and -100:
- 0 means the close is at the top of the recent range
- -100 means the close is at the bottom of the recent range
- -20 to 0 is the conventional overbought zone
- -80 to -100 is the conventional oversold zone
That negative scale is the single most common source of confusion. A reading of -10 is more overbought than a reading of -30, because -10 is closer to zero. If you're used to RSI or Stochastic counting up toward strength, Williams %R counting up toward zero (which represents strength) takes a session or two to internalize.
Typical Williams %R parameter values
- Period (lookback):
14(default),9for faster signals,20–28for smoother - Overbought threshold:
-20(default),-10for stricter reversal-short entries - Oversold threshold:
-80(default),-90for stricter reversal-long entries - Source: high/low/close (fixed — Williams %R uses the full range, not a single price field)
- Best timeframes: 15m–1h for reversal scalps; 4h for swing-level pullback entries
Williams %R vs Stochastic: Same Math, Different Speed
Williams %R and Stochastic %K are mathematically related — %R is essentially %K − 100, just without the smoothing that Stochastic applies to produce %D. That relationship explains both indicators' behavior:
| Williams %R | Stochastic %K/%D | |
|---|---|---|
| Scale | 0 to -100 (inverted) | 0 to 100 |
| Smoothing | None — raw calculation | %D is a moving average of %K |
| Overbought | -20 to 0 | 80 to 100 |
| Oversold | -80 to -100 | 0 to 20 |
| Signal lag | Minimal — reacts to every new bar | Slightly delayed by %D smoothing |
| Noise level | Higher, especially in chop | Lower, filtered by the signal line |
| Best for | Fast reversal detection, scalping | Confirmed crossovers, swing entries |
Because Williams %R has no signal-line smoothing, it reaches extreme readings sooner than Stochastic — often a bar or two earlier. That speed is the entire value proposition: for a strategy built to catch the first tick of a reversal, Williams %R gets there first. The tradeoff is more false extremes during choppy, low-volatility conditions, since there's no %D line to filter out one-bar spikes.
If you already run a Stochastic-based bot, Williams %R is not a replacement — it's a faster, noisier sibling. Some traders run both: Stochastic for the confirmed signal, Williams %R for the early warning.
Reading Williams %R Signals
1. Overbought / oversold extremes
A reading above -20 flags an overbought condition; below -80 flags oversold. On their own, these are context markers, not trade triggers — an asset in a strong trend can sit pinned near 0 or -100 for many consecutive bars.
Williams %R spends far more time at the extremes than RSI or Stochastic do, simply because it lacks smoothing. Treating every -20 crossing as a short signal in an uptrend will generate a steady stream of false entries. Pair extremes with a trend filter before acting on them.
2. Exit-from-extreme
The more reliable signal is not the extreme itself but the exit from it: %R rising back above -80 after dipping below it (bullish), or falling back below -20 after rising above it (bearish). This costs a small amount of lag compared to catching the exact bottom, but it filters out readings that immediately reverse.
3. Failure swings
A failure swing is Williams %R's version of divergence: price makes a new low, but %R fails to make a correspondingly deep new low. This suggests selling pressure is fading even though price hasn't turned yet — the same concept covered in the MACD strategy guide's divergence section, applied to a faster oscillator.
4. Midline crosses
Some traders use the -50 level as a bias filter: %R above -50 favors long setups, below -50 favors short setups. This is a coarser signal than the extreme-zone approach but works well as a higher-timeframe context filter.
Building a Williams %R Strategy in VolatiCloud
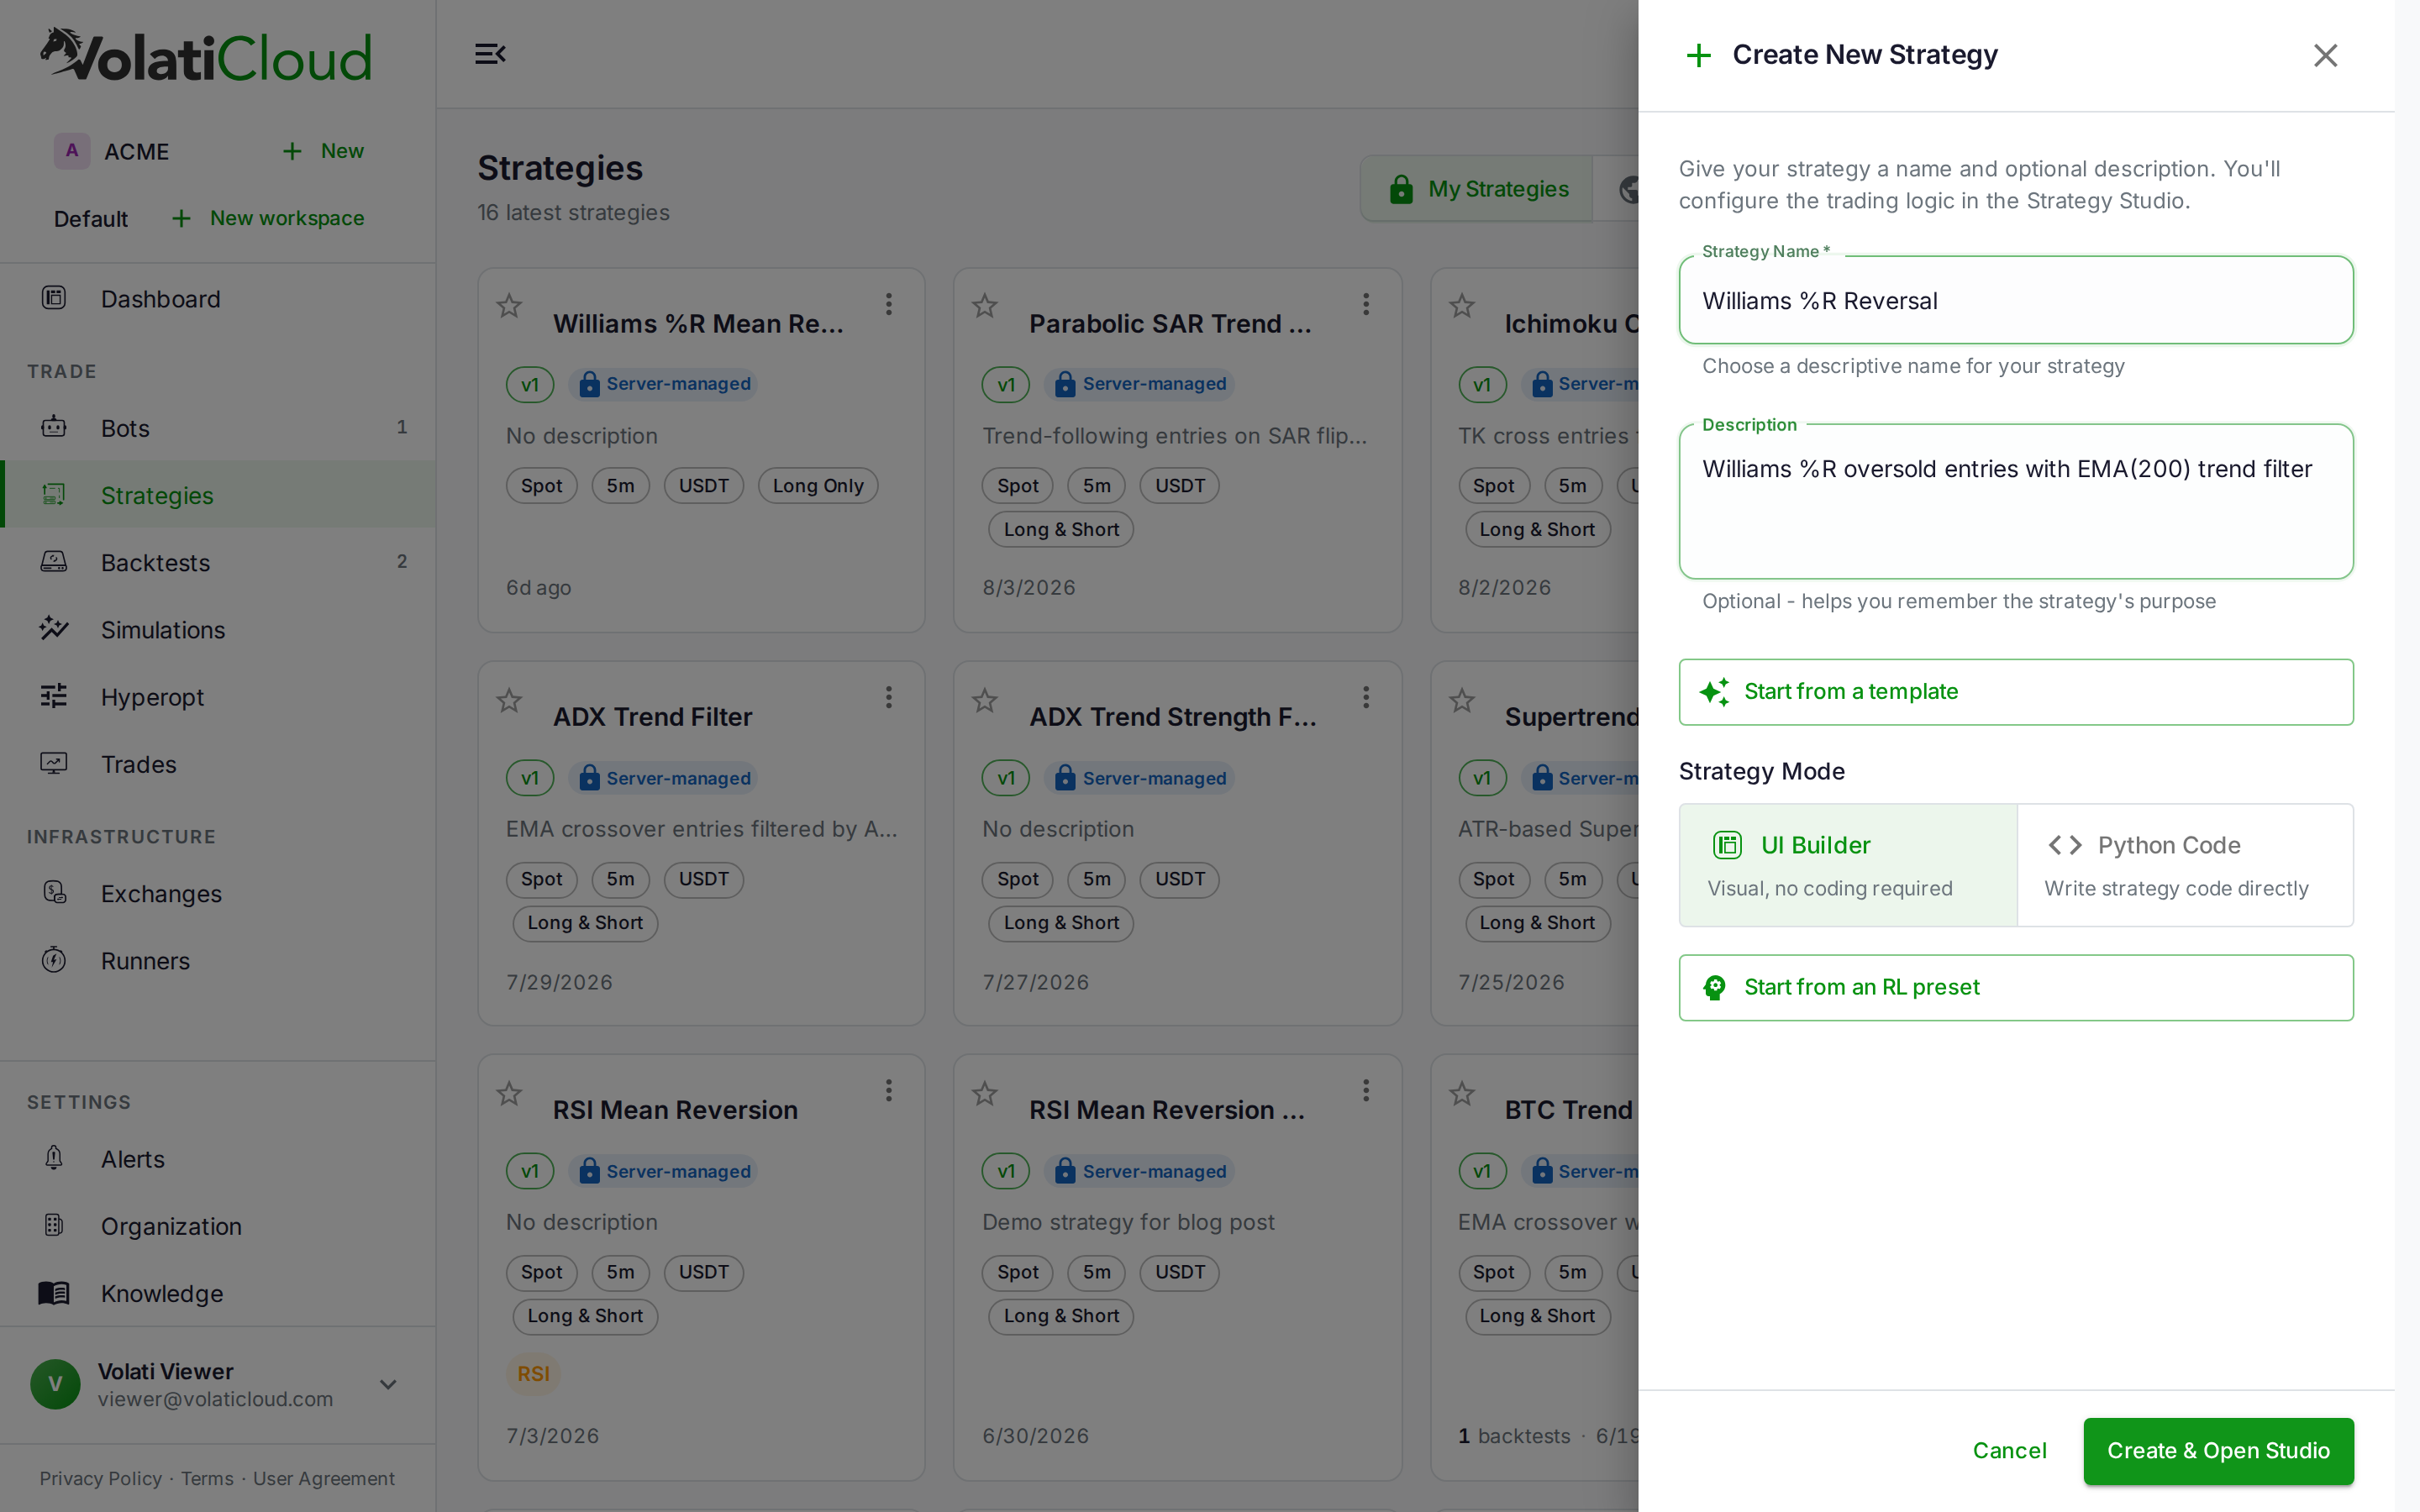
Start from Strategies -> New. Name the strategy, then pick UI Builder for a visual, no-code definition or Python Code to write the logic directly — the rest of this walkthrough uses the UI Builder.
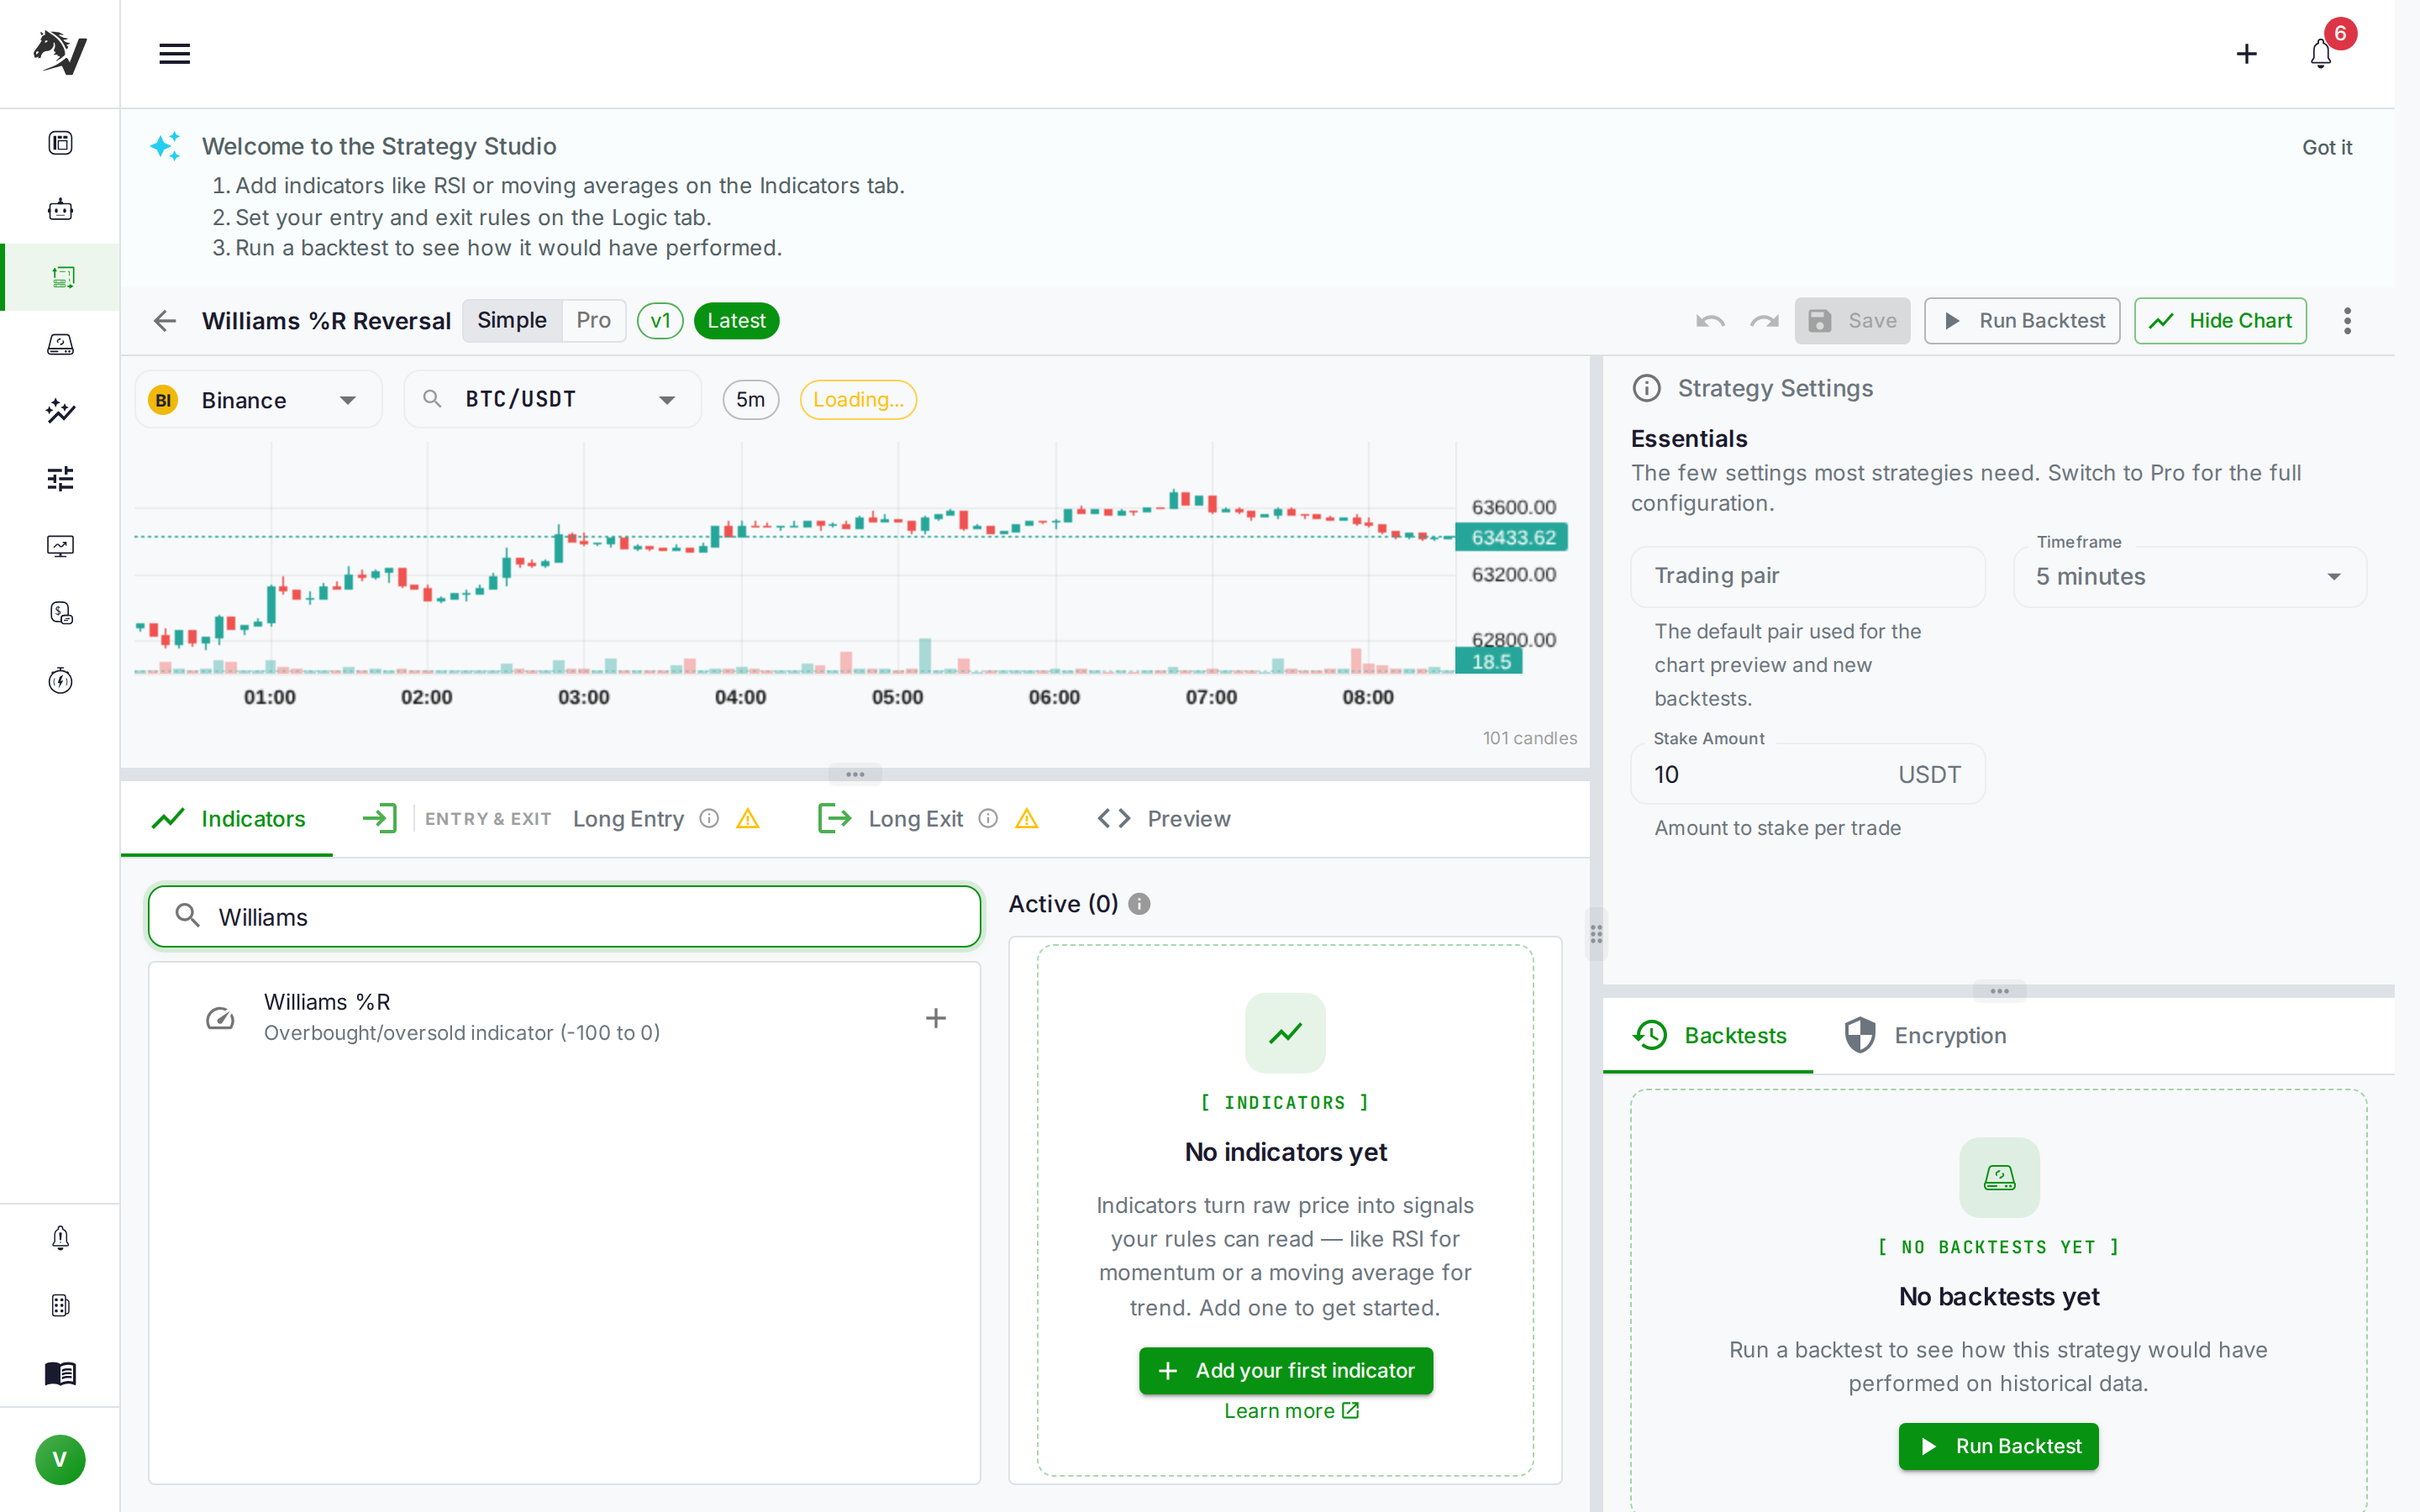
The Strategy Builder exposes WILLR as a momentum-category indicator with a single configurable parameter — period, defaulting to 14. Search "Williams" in the Indicators tab and the node appears with its output range labeled directly: Overbought/oversold indicator (-100 to 0).
A minimal long-entry condition:
%R < -80                 # in oversold zone
AND %R crosses above -80 # exiting the zone, momentum turning up
In the UI Builder, this is a COMPARE node checking the zone boundary combined with a CROSSOVER node for the exit trigger, both required to be true on the same candle.
A practical strategy: Williams %R pullback with trend filter
On its own, raw Williams %R fades every extreme reading — a losing strategy in trending markets. Filtering entries with a higher-timeframe trend indicator turns it into a pullback-timing tool instead of a counter-trend gamble.
Entry conditions (long):
- Price is above the 200-period EMA (uptrend confirmed)
- Williams %R falls below -80 (pullback into oversold territory)
- Williams %R crosses back above -80 (momentum recovering)
Exit conditions:
- Take profit at 1.5–2× the entry's ATR
- Trailing stop at 1× ATR from the high watermark
- Or: exit when Williams %R crosses above -20 and then back below -20
This mirrors the EMA crossover strategy's trend-filter approach and the Stochastic oversold + EMA filter setup — the trend filter does the heavy lifting in both cases, with the oscillator only responsible for timing entries within the established direction.
For the short side, long/short mirror mode auto-generates the inverse conditions: price below the 200 EMA, %R above -20, then crossing back below -20.
Because Williams %R reacts a bar or two faster than Stochastic, this setup tends to enter slightly earlier — sometimes catching more of the move, sometimes catching a pullback that hasn't finished. Backtest both oscillators on the same pair before committing to one.
Backtesting Williams %R Parameters
The parameters worth exploring in the backtester are period, and the overbought/oversold thresholds:
- Shorter periods (7–9) increase signal frequency and further reduce lag — useful for scalping timeframes, but the noise increase is proportionally larger than with Stochastic
- Standard period=14 is the reasonable default across most timeframes
- Tightening the oversold threshold from -80 to -90 reduces trade count but tends to raise win rate, since entries wait for a deeper extreme
- Tightening overbought from -20 to -10 has the mirrored effect on the exit/short side
A hyperopt parameter space for this indicator typically looks like:
{
  "willr_period": { "type": "int", "low": 7, "high": 28, "step": 1 },
  "oversold": { "type": "int", "low": -95, "high": -75, "step": 1 },
  "overbought": { "type": "int", "low": -25, "high": -5, "step": 1 }
}
Run this through VolatiCloud's hyperparameter optimization rather than hand-tuning — with three interacting parameters, manual tuning almost always lands on a combination that looks better than it performs out-of-sample. After a run, check how to read a backtest for the metrics that actually distinguish a robust parameter set from a lucky one.
Because Williams %R has no smoothing, it is unusually sensitive to source data quality. If a backtest shows suspiciously frequent whipsaws right at the threshold levels, check the historical data availability for the pair and timeframe before assuming the strategy itself is broken.
Common Williams %R Mistakes
Misreading the scale. -15 is more overbought than -25, even though -25 is the "bigger" number. This trips up traders coming from RSI or Stochastic. Double-check your condition direction (< vs >) against the negative scale before saving the strategy.
Fading every extreme without a trend filter. Williams %R spends long stretches pinned near 0 or -100 during strong trends. Trading every touch of -20 or -80 in isolation is a reliable way to fight the trend repeatedly.
Treating it as a standalone signal. Williams %R shows range position only — no volume, no trend direction, no volatility context. Combine it with at least one indicator from a different category, as shown in the multi-timeframe strategies guide.
Ignoring the noise-speed tradeoff. The lack of smoothing that makes Williams %R fast also makes it noisy. If a backtest shows a huge trade count relative to a Stochastic-based version of the same idea, that's expected — check whether the extra trades are actually adding profit or just adding fees. The exchange fee optimization guide covers how trade frequency interacts with cost drag.
Williams %R in VolatiCloud's Strategy Builder
VolatiCloud supports WILLR natively in the visual Strategy Builder, alongside Stochastic, RSI, and the rest of the momentum indicator library. Configure the period, wire the output into COMPARE and CROSSOVER nodes, and combine it with a trend or volatility indicator — no code required.
For a customized implementation — failure-swing detection, or a Williams %R variant applied to a smoothed price series — the Code Mode gives direct access to Python and the technical-analysis library Freqtrade runs on.
Once the strategy is built, run it through the backtester across a window that includes both trending and ranging conditions. A Williams %R strategy tuned only on a ranging period will produce a wave of false reversal signals the moment a real trend starts.
Get Started with a Williams %R Bot
Open the Strategy Builder in VolatiCloud and add a Williams %R indicator node from the momentum category. Pair it with an EMA trend filter, backtest over 6–12 months of data, then run walk-forward optimization to confirm the thresholds hold up on data the strategy hasn't seen.
New to indicator-based strategies? Start with how to build a strategy step by step before tuning parameters.