EMA Crossover Strategy for Crypto: Trend-Following Bots

Most profitable algorithmic strategies fall into one of two camps: they bet that prices will revert to an average, or they bet that a price move will keep going. RSI mean reversion belongs to the first camp. EMA crossover belongs to the second. The classic 12/26 fast-slow EMA pair has the advantage of being simple to backtest and almost trivial to encode visually — but it has well-documented failure modes (sideways chop, false breakouts) that any production deployment has to handle. This guide walks through building a crossover strategy in VolatiCloud, adding the 200-period EMA trend filter that materially improves win rate, and tuning the periods with hyperopt before live deployment.
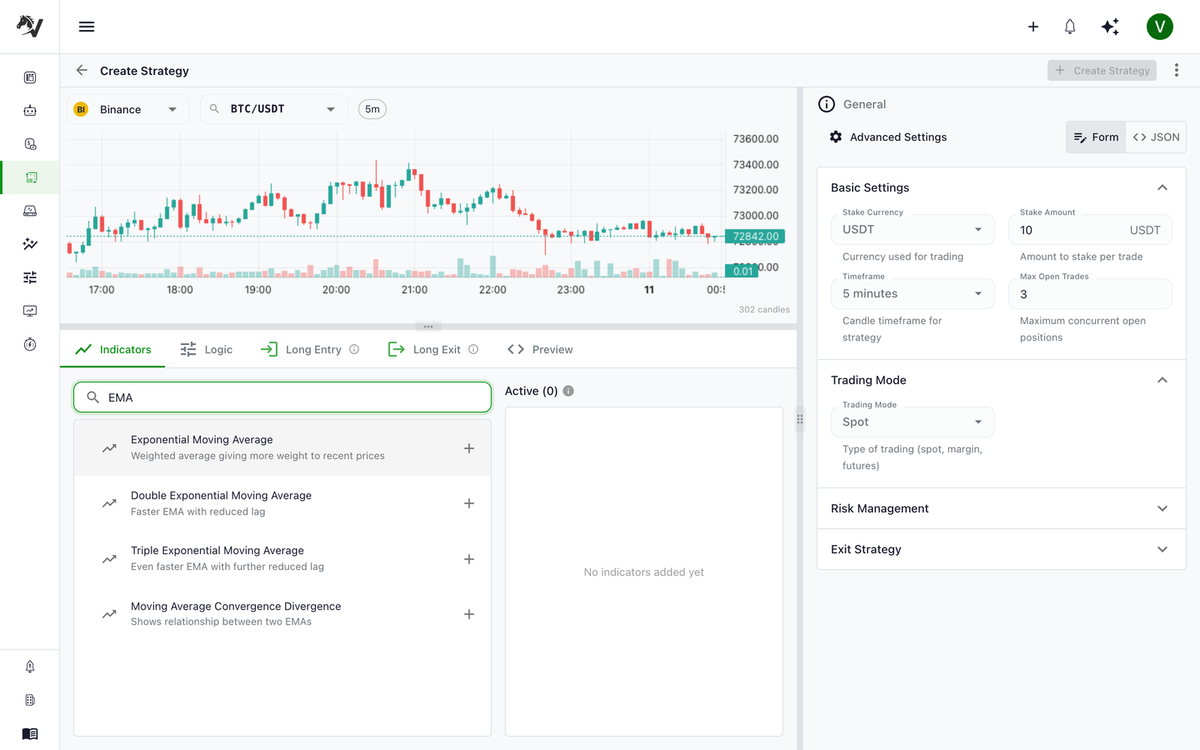
What Is an EMA and Why Traders Use It
An Exponential Moving Average (EMA) is a moving average that gives more weight to recent price data. Unlike a simple moving average (SMA), which treats every bar equally, the EMA reacts faster to new price action. The weight applied to each new candle is determined by the period:
Multiplier = 2 / (period + 1)
EMA(t) = (Price(t) × Multiplier) + (EMA(t−1) × (1 − Multiplier))
A 12-period EMA reacts quickly to price changes; a 26-period EMA moves more slowly. When the fast EMA crosses above the slow EMA, momentum is shifting upward. When it crosses below, momentum is shifting downward. That crossing event is the signal.
The EMA crossover is one of the most studied signals in technical analysis — not because it's magical, but because it captures a real phenomenon: trends tend to persist for longer than random chance would predict. When a market breaks out, it often keeps running.
Typical EMA crossover parameter values
- Fast EMA period:
12(default),8for faster response,21for slower - Slow EMA period:
26(default),50for medium-term swings,100for position trading - Trend filter EMA period:
200(Smith standard),100for shorter holding periods - Source:
close(default) - Best timeframes: 1h and 4h candles for active strategies; daily for position trading
EMA Crossover vs RSI Mean Reversion
Before building a crossover strategy, it's worth understanding when each approach is most effective:
| Characteristic | EMA Crossover (trend-following) | RSI Mean Reversion |
|---|---|---|
| Market condition | Trending markets | Range-bound markets |
| Trade frequency | Low (waits for sustained moves) | High (trades frequent bounces) |
| Typical trade duration | Days to weeks | Hours to days |
| Win rate | Often below 50% | Often above 50% |
| Risk/reward ratio | High (large winners, small losers) | Lower (small winners, small losers) |
| Drawdown profile | Long flat periods between trends | More frequent, smaller drawdowns |
Both can be profitable in the right conditions. The key insight is that they perform best at different times — making them strong candidates for running simultaneously as separate bots.
If you're new to the mean reversion side of this equation, the RSI mean reversion strategy guide walks through that strategy step by step.
The Classic 12/26 EMA Crossover Setup
The most commonly tested EMA crossover uses a 12-period fast EMA and a 26-period slow EMA. These same periods underpin the MACD indicator, which is essentially a normalized view of the difference between the two EMAs.
Entry rules:
- Long entry: 12 EMA crosses above 26 EMA
- Long exit: 12 EMA crosses below 26 EMA (or a separate stop-loss triggers)
For a short-only or long/short strategy, the reverse signals apply. The long/short mirror mode guide shows how to generate both directions from a single condition tree without duplicating logic.
On longer timeframes (1h, 4h, daily), EMA crossover strategies generate fewer but more reliable signals. On 5-minute charts, the signal noise increases significantly and transaction costs consume most of the edge.
The 200-EMA trend filter
A common variation adds a 200-period EMA as a trend filter: only take long signals when price is above the 200 EMA, and only take short signals when price is below it. This filter reduces total trades but typically improves win rate by 5–10 percentage points on backtests, because it removes counter-trend signals during persistent directional moves.
Building This Strategy in VolatiCloud
VolatiCloud's Strategy Builder has dedicated CROSSOVER nodes that make this setup straightforward — no Python required.
Step 1 — Open the Strategy Builder
In the VolatiCloud console, create a new strategy and select UI Builder mode. The canvas opens with an empty condition tree.
Step 2 — Add the long entry condition
Drag a CROSSOVER node onto the canvas. Configure it with:
indicator_a: EMA, period 12, sourcecloseindicator_b: EMA, period 26, sourceclose- Direction: upward (fast crosses above slow)
Step 3 — Add the 200-EMA trend filter
Add a COMPARE node:
- Left operand: EMA, period 200, source
close - Operator:
lt(less than) - Right operand: PRICE (close)
This reads as "close price is above the 200 EMA."
Connect the CROSSOVER node and the COMPARE node with an AND node. The strategy only enters a long trade when both conditions are true simultaneously.
Step 4 — Set stop-loss and ROI
Under the bot configuration, set a stop-loss percentage (e.g., −3%) and a minimum ROI target (e.g., +5% at 24h). Trend-following strategies typically use wider stop-losses than mean reversion strategies because the trade needs room to develop. For a volatility-adjusted alternative, see the ATR stop-loss strategy guide.
Step 5 — Choose a timeframe
1h or 4h candles are a good starting point for EMA crossover. The signal appears less frequently but each signal carries more weight. A 4h EMA crossover typically generates 5–10 trades per month per pair.
Why a Sub-50% Win Rate Can Still Be Profitable
New traders often abandon trend-following strategies after seeing backtests with a 38% win rate. This is a mistake. A strategy that wins 35% of its trades but makes 4× its risk on winners still has a positive expectancy:
Expected value per trade = (0.35 × 4R) − (0.65 × 1R)
                         = 1.40R − 0.65R
                         = +0.75R per trade
Where R is the amount risked per trade. A strategy with this profile makes money over time. It just requires the discipline not to abandon it during the losing streaks — and automated bots have an advantage here, since they don't get discouraged after five losing trades. The bot executes the next signal exactly as it would have after five winners.
Backtesting EMA Crossover Strategies
EMA crossover strategies deserve careful backtesting because they're prone to two specific failure modes.
1. Overfitting to bull market conditions
If your backtest window only covers a bull run, the strategy looks spectacular. Run the same strategy over a ranging or bear market period and performance often collapses. Always test across at least two full market cycles. The avoiding overfitting guide covers this in detail.
2. Whipsawing in low-volatility ranges
When the market chops sideways, a crossover system generates multiple false signals in quick succession. The fast EMA crosses above, then below, then above again, each time triggering a trade that loses to fees and stop-loss. The 200-EMA filter described above reduces this materially but doesn't eliminate it.
VolatiCloud's backtest runner lets you specify exact date ranges, so you can deliberately test your strategy through difficult periods. Run separate backtests for:
- A sustained trending period (e.g., late 2020 or Q1 2024)
- A prolonged ranging/consolidating period (e.g., mid-2023)
- A sharp drawdown or black swan event (e.g., May 2022 LUNA collapse)
If the strategy survives all three with acceptable drawdown, you have more confidence in its robustness. See running backtests for step-by-step instructions and analyzing results for how to read the metrics.
Tuning EMA Periods with Hyperopt
The 12/26 combination is a common starting point, not a magic number. Different pairs and timeframes respond to different EMA periods. VolatiCloud's hyperparameter optimization can search the parameter space systematically without running dozens of individual backtests by hand.
A reasonable parameter space for EMA crossover optimization:
{
  "fast_period": {
    "type": "int",
    "low": 8,
    "high": 21,
    "step": 1
  },
  "slow_period": {
    "type": "int",
    "low": 20,
    "high": 50,
    "step": 2
  }
}
When optimizing EMA periods, always validate results on out-of-sample data. An optimizer with enough freedom will always find a combination that looks good on the training window. That doesn't mean it will work going forward. Use a separate validation date range that the optimizer never saw — or apply walk-forward optimization for a stronger robustness signal.
The hyperparameter optimization guide covers how to configure parameter spaces and interpret the results.
Running EMA Crossover Alongside a Mean Reversion Bot
One practical approach is to run both strategy types simultaneously on the same trading pair:
- EMA crossover bot at 4h timeframe — captures large directional moves
- RSI mean reversion bot at 1h timeframe — collects smaller, frequent profits in ranging conditions
During a trending period, the EMA bot captures the bulk of the move while the RSI bot may struggle with false reversals. During a ranging period, the RSI bot earns steady returns while the EMA bot sits idle or takes small losses on failed breakouts.
Neither strategy needs to be exceptional in isolation for the combination to produce a smoother equity curve. Reducing correlation between your bots' signals is one of the more reliable ways to improve portfolio-level performance.
VolatiCloud supports running multiple bots with different strategies, timeframes, and exchange connections independently. Each bot has its own configuration, stop-loss, and ROI target. You can monitor all of them from a single dashboard and get notified when any of them opens or closes a trade.
What to Expect During Live EMA Trading
A few practical observations for anyone moving an EMA crossover strategy from backtest to live.
Fewer signals than you expect. A 4h EMA crossover might generate only 5–10 trades per month on a single pair. This is normal. Forcing more signals usually means reducing the timeframe, which increases noise.
Flat periods are uncomfortable but expected. Between trends, the strategy does nothing — or takes small losses on false starts. Periods of weeks with no significant profit are part of the strategy's nature, not a sign that something is broken.
Slippage matters less than in higher-frequency strategies. Because entries and exits are triggered on candle closes rather than intraday ticks, the actual execution price is usually close to the signal price.
Before deploying real capital, run the strategy in paper trading mode for several weeks to observe how it behaves in current market conditions without any financial risk.
Get Started with an EMA Crossover Bot
EMA crossover strategies are a strong foundation for any algorithmic trading portfolio. They require patience, but when trends develop, they capture moves that most discretionary traders miss by getting out too early.
To build your own EMA crossover strategy:
- Open the VolatiCloud console and create a new strategy
- Use the Strategy Builder to configure your crossover conditions
- Run a backtest across multiple market conditions using the backtesting guide
- Tune your EMA periods with hyperparameter optimization and validate on out-of-sample data
- Stress-test with Monte Carlo simulation before deploying
The visual strategy builder post covers the full builder interface if you're setting up your first strategy.