RSI Mean Reversion Strategy: Build a Crypto Trading Bot

"RSI below 30 is oversold — buy" sounds like a complete strategy until you actually trade it. Run that single rule on BTC/USDT through the May 2022 capitulation and you'd have entered seven losing trades while RSI(14) sat below 30 for 41 consecutive days. The signal was working exactly as designed; the problem is that "oversold" is not the same as "about to bounce." This guide walks through building a real RSI mean reversion strategy in VolatiCloud — period selection, fresh-cross filtering, stop-loss configuration, and the backtests that tell you whether the edge is real before any capital is at risk.
What Mean Reversion Actually Assumes
Mean reversion is the idea that prices tend to drift back toward a historical average after an extreme move. The assumption isn't that markets are efficient — it's almost the opposite: that short-term overreactions create predictable recovery opportunities you can systematically harvest.
RSI (Relative Strength Index) is a momentum oscillator developed by J. Welles Wilder Jr. in 1978 and described in his book New Concepts in Technical Trading Systems. It measures the ratio of average gains to average losses over a lookback period, then normalizes that ratio to a 0–100 scale:
RSI = 100 − (100 / (1 + RS))
RS  = Average Gain / Average Loss (over N periods, default 14)
An RSI reading above 70 suggests recent gains significantly outpaced losses — a potential exhaustion signal. A reading below 30 suggests the opposite. The mean reversion hypothesis: when RSI drops to an extreme low, the selling pressure that caused it is likely temporary, and price should recover toward the mean.
The assumption holds in ranging markets and breaks down in trending markets. This is why entry conditions alone are never enough — you also need clear exit rules, a stop-loss, and a tested set of parameters.
Typical RSI parameter values
Wilder originally proposed period 14 on daily charts. In crypto, the most-tested defaults are:
- Period:
14(standard),7for faster signals,21for smoother signals - Oversold threshold:
30(standard),25or20for stricter setups - Overbought threshold:
70(standard),75or80for stricter setups - Source:
close(standard),hlc3to reduce wick sensitivity
The Problem with the Standard 30/70 Rule
The "buy below 30, sell above 70" rule is everywhere because it's easy to explain. The problem is that it tells you nothing about:
- How long to hold: RSI can stay below 30 for weeks during a real downtrend
- Where to cut losses: mean reversion trades have a clear invalidation point that the rule alone never names
- Which timeframe to use: RSI(14) on the 1-hour chart and RSI(14) on the daily chart are almost different indicators
- Which assets it works on: RSI mean reversion performs differently on BTC than on altcoins than on lower-liquidity pairs
These aren't theoretical concerns. Run an unoptimized RSI strategy on BTC/USDT from January 2022 through June 2022 and you catch every "oversold" bounce attempt during a sustained bear market — losing on each. The signal was never wrong about RSI being oversold. The market was genuinely oversold for months.
This is why parameter selection and backtesting matter before you fund a live bot.
Building the RSI Strategy in VolatiCloud's Strategy Builder
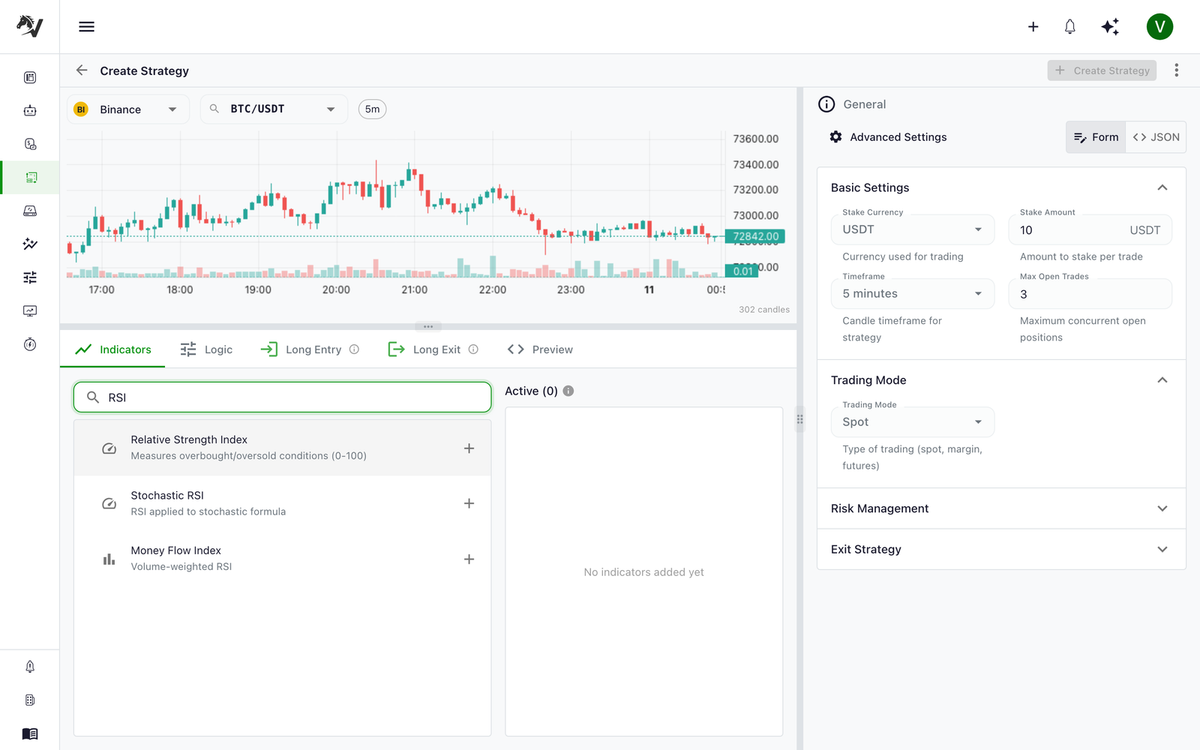
VolatiCloud's Visual Strategy Builder lets you construct entry and exit conditions using draggable nodes — no Python required. Here's how to translate RSI mean reversion logic into a working strategy.
Step 1: Create a New Strategy
Navigate to console.volaticloud.com, open your organization, and create a new strategy. Give it a descriptive name like RSI Mean Reversion — BTC/USDT 4H that captures both the pair and the timeframe you'll test first. VolatiCloud uses immutable strategy versions, so your initial backtest configuration will always be preserved as you iterate.
Step 2: Configure the Entry Condition
In the Strategy Builder canvas, build a condition tree for your buy signal:
- Add an RSI indicator node from the indicator palette
- Set
periodto14 - Set
sourcetoclose
- Set
- Add a COMPARE node
- Left operand: the RSI node output
- Operator:
lt(less than) - Right operand:
30(CONSTANT)
- Connect the RSI node output to the COMPARE node
This encodes: enter when RSI(14) < 30.
For a more selective entry, wrap this in an AND node and require that RSI was at or above 30 on the previous candle. This filters for a fresh cross below the threshold rather than catching a prolonged oversold condition:
AND
├── RSI(14) < 30                  (current candle)
└── RSI(14, shift=1) >= 30        (previous candle — fresh cross)
This filters out cases where RSI has been sitting below 30 for multiple candles, which often signals a genuine downtrend rather than a recoverable dip.
Step 3: Configure the Exit Condition
A mean reversion trade has two natural exits:
Profit target. Exit when RSI recovers to a neutral level (e.g., 55 or 60). This captures the snap-back move without overstaying.
Stop-loss. This is where most beginners skip a step. Set a percentage-based stop-loss in the bot configuration — typically 3–5% below entry. If price continues falling instead of recovering, you exit before the loss compounds.
The exit signal lives in the Strategy Builder's logic tree:
RSI(14) > 55 (profit signal: RSI recovered toward neutral)
The hard stop-loss is configured separately at the bot level, not in the Strategy Builder's logic tree. Set it in your bot configuration as stoploss: -0.04 for a 4% hard stop. If you want a volatility-adjusted stop instead of a fixed percentage, the ATR stop-loss strategy guide shows how to size stops to current market conditions.
Step 4: Set the Timeframe
The timeframe has a bigger impact on results than most traders realize. RSI(14) on the 15-minute chart generates dozens of signals per week, many of them noise. RSI(14) on the 4-hour chart generates 2–5 signals per week and gives each trade room to develop.
Start with the 4-hour timeframe for mean reversion testing. It reduces noise while still capturing short-to-medium-term corrections. Run parallel backtests across timeframes once you have a baseline to compare against.
Backtesting the RSI Strategy
Once your conditions are set, run a backtest. VolatiCloud's backtesting engine uses real historical OHLCV data to simulate how your strategy would have traded. See Crypto Backtesting Deep Dive for the full backtest flow, and the running backtests guide for the step-by-step UI walkthrough.
Choose a representative date range
Avoid testing only during favorable market conditions. For BTC/USDT, use at least 18 months that include both trending and ranging periods. A strategy that only works during sideways consolidation is not production-ready.
RSI metrics that matter for mean reversion
After the backtest completes, focus on these in the analyzing results guide:
| Metric | What to look for |
|---|---|
| Win rate | Mean reversion typically wins 55–70% of trades; below 50% suggests poor signal quality |
| Profit factor | Above 1.3 is solid; above 1.5 is strong |
| Max drawdown | Should be proportional to stop-loss; if you set 4% stop-loss but max drawdown is 25%, you're compounding losses through frequency |
| Average trade duration | Should be hours to days, not weeks; trades sitting open for 3+ weeks suggest exit conditions need adjustment |
| Sharpe ratio | Above 1.0 indicates returns aren't just a bull market tailwind |
| Trade count | Below 30 trades makes results statistically unreliable |
If your backtest generated fewer than 20 trades over 12 months, the win rate and profit factor are dominated by chance. Adjust the entry threshold or shorten the timeframe before drawing conclusions.
Tune the RSI parameters with hyperopt
If initial results underperform, adjust parameters systematically rather than abandoning the strategy. VolatiCloud's hyperparameter optimization can search the parameter space automatically across configurable epochs:
- RSI period: try 7, 10, 14, 20 — shorter periods are more reactive, longer periods smoother
- Entry threshold: try 25, 30, 35 — lower thresholds give fewer but stronger signals
- Exit threshold: try 50, 55, 60 — higher exits increase profit per trade but reduce win rate
- Stop-loss percentage: try 2%, 4%, 6% — tighter stops reduce individual losses but increase stop-out frequency
Run hyperopt with 50–100 epochs to find a promising configuration, then run a second backtest on a separate date range (out-of-sample) to verify the results aren't overfit to the training period.
Common RSI Mean Reversion Mistakes
Testing only in favorable conditions
If you backtest a mean reversion strategy exclusively during a sideways market, you'll get great numbers that don't hold in production. Always include at least one significant trend period — ideally one uptrend and one downtrend — in your test range.
No stop-loss
"Mean reversion will eventually work" is true in theory and catastrophic in practice. A coin can trend against you for months. Define when you're wrong and exit accordingly. The stop-loss isn't an admission of defeat; it's what keeps a bad trade from becoming a portfolio-destroying one.
Over-optimizing the RSI threshold
If you arrive at RSI < 23.7 because it performed best across 500 backtest runs, that specificity is almost certainly noise. Use round numbers and test across wider ranges. Parameter combinations that hold up across multiple nearby settings are more robust than the single peak-performing configuration. The avoiding overfitting guide covers this in detail.
Ignoring trade frequency
A strategy with 80% win rate across 8 trades is not statistically meaningful. You need a minimum of 30–50 completed trades before the percentages carry real weight. If your backtest produces fewer trades than that, adjust the timeframe or relax the entry threshold.
Validating with Monte Carlo Simulation
Even a well-backtested RSI strategy can underperform due to trade-sequence randomness. VolatiCloud's Monte Carlo simulation stress-tests your strategy by shuffling historical trades thousands of times and computing the distribution of possible outcomes.
For a mean reversion strategy, focus on:
- 95th percentile max drawdown: the worst-case scenario your strategy could realistically face, even if that exact sequence hasn't occurred historically
- Probability of positive return: if 25–30% of shuffled scenarios end negative, you have a high-variance strategy that requires appropriate position sizing before deployment
If Monte Carlo results show resilience across shuffled sequences, you have genuine confidence the signal is real rather than an artifact of historical data ordering. If results are fragile, either tighten the strategy or reduce position size to match actual risk.
Deploying a Live RSI Bot
Once you're satisfied with backtest and Monte Carlo results, deploying is straightforward:
- Create a bot and attach your RSI mean reversion strategy
- Choose a bot runner — start in paper trading (dry-run) mode to observe live signal generation without real capital
- Connect an exchange account using VolatiCloud's exchange wizard, which guides you through API key setup with only the permissions your bot actually needs
- Set
max_open_trades: 1for your first live run — don't run multiple concurrent RSI bots until you've confirmed the strategy behaves consistently with your backtest
Paper trade for at least 2–4 weeks. Compare the live signals to what your backtest predicted. If signal frequency, trade duration, and win rate look similar, you have a consistent strategy ready for live capital.
Backtests are simulations. Live markets have slippage, partial fills, and occasional API latency. Your first live deployment should use a position size small enough to be real but not large enough to matter if live results diverge from your backtest.
Pairing RSI with Other Indicators
RSI is rarely the strongest standalone strategy in crypto. Common reinforcements:
- RSI + Bollinger Bands: require both an RSI < 30 reading and a close below the lower Bollinger Band before entering. The Bollinger Bands strategy guide covers the band side of that combination.
- RSI + MACD divergence: skip RSI entries when the MACD histogram is still expanding negatively — momentum hasn't yet confirmed the reversal.
- RSI + EMA trend filter: only take RSI < 30 longs when price is above a longer-period EMA. The EMA crossover strategy guide explains how trend filters work and why they reduce mean-reversion failures during sustained downtrends.
RSI Mean Reversion Checklist
Before going live, verify:
- Backtested across both trending and ranging market conditions
- At least 30 completed trades in the backtest for statistical validity
- Stop-loss is set and proportional to your entry threshold
- Out-of-sample validation on a date range not used during optimization
- Monte Carlo simulation shows resilience across shuffled trade sequences
- Paper traded for at least 2 weeks with consistent signal behavior
- Position sizing accounts for actual risk tolerance (see risk management and position sizing)
Start Building Your RSI Bot
The RSI mean reversion strategy is one of the most well-studied approaches in algorithmic trading because the logic is sound, the signals are measurable, and the failure modes are predictable. The edge isn't in the indicator itself — it's in the discipline of testing it properly and deploying only when the data supports it.
VolatiCloud's Strategy Builder lets you express this logic visually and iterate quickly. Backtesting runs against real historical OHLCV data, and Monte Carlo simulation adds a layer of robustness validation that most traders skip entirely. When you're ready to go live, paper trading gives you a final check against real market conditions before any capital is at risk.
Start building your RSI strategy on VolatiCloud. The first backtest takes a few minutes to configure, and you'll have data-driven answers instead of guesses.