Crypto Bot Risk Management: Position Sizing That Survives

A strategy with a 70% win rate and a 50% stake size loses two-thirds of an account on five consecutive losing trades — and five-loss streaks happen multiple times a year even at 70% accuracy. A 55% win-rate strategy with 5% stakes barely flinches at the same streak and keeps compounding. The signal logic gets all the attention, but it's the position-sizing rules underneath that decide whether your bot is around to take the next trade.
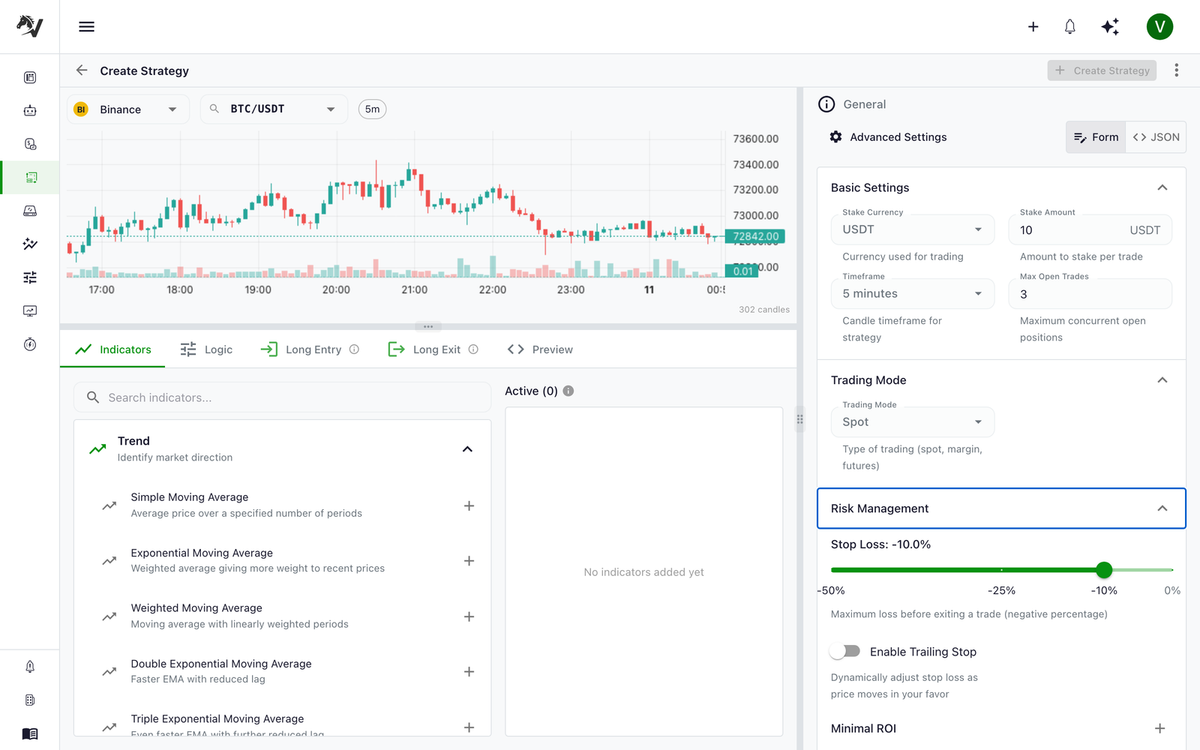
This guide covers the four parameters that drive risk in any automated crypto bot — stake amount, stoploss, max open trades, and correlation budget — how to set each one defensibly, and how to validate the combination before live capital touches an exchange.
Why Position Sizing Outweighs Signal Quality in Crypto
Consider two strategies running side by side on the same pair:
| Metric | Strategy A | Strategy B |
|---|---|---|
| Win rate | 70% | 55% |
| Stake per trade | 50% of balance | 5% of balance |
| Stoploss | -20% | -5% |
| After 5 consecutive losses | -65% drawdown | -23% drawdown |
Strategy A looks better on the metrics any newcomer reads first. But the binomial probability of five consecutive losses with a 70% win rate is roughly 0.24% per five-trade window — meaning over a few hundred trades it will happen multiple times. When it does, Strategy A is down two-thirds of the account and needs a +186% gain to recover. Strategy B is down 23% and needs +30%.
The math behind this is the Kelly Criterion, which prescribes the optimal bet fraction as a function of your edge (win rate × win amount minus loss rate × loss amount). Most practitioners use a fraction of Kelly — typically 25–50% — because Kelly is sensitive to estimation error, and crypto win rates are estimated from finite trade samples that drift over time.
The practical takeaway: smaller position sizes give your edge more chances to play out before a drawdown buries the account. The 55% strategy with conservative sizing is mathematically more durable than the 70% strategy with aggressive sizing.
The Three Core Risk Parameters Every Crypto Bot Needs
Before tuning a single indicator, configure these three parameters correctly:
stake_amount — capital deployed per trade, set as either a fixed currency amount or a percentage of your current balance. Percentage-based sizing compounds naturally with the account (and shrinks with it after losses); fixed sizing is more predictable for accounting purposes.
stoploss — the maximum loss accepted on a single trade before the bot closes the position. Expressed as a negative percentage in Freqtrade configs (-0.05 means -5%). This is the primary protection against single-trade catastrophes.
max_open_trades — the cap on simultaneous positions. Combined with stake amount, this caps total exposure. A bot with stake_amount: 10% and max_open_trades: 5 deploys at most 50% of balance at any moment.
These parameters interact. Tune them together, not independently — the bot creation guide walks through the form fields in order.
Fixed vs. Percentage-Based Stake Amounts
Both approaches are valid. The choice depends on your goals:
Fixed stake (e.g., $100 per trade):
- Predictable cost per trade regardless of account size
- Easier to track in accounting software
- Doesn't naturally adjust as account grows or shrinks
- Risk: after losses reduce your account, fixed stakes represent a larger percentage of remaining balance
Percentage of balance (e.g., 5% per trade):
- Automatically scales with account growth — a winning streak compounds more aggressively
- Naturally reduces position size after drawdowns, giving you a self-protective quality
- Makes it easier to reason about maximum possible loss sequences
- Risk: small percentages on large accounts may not be worth the transaction fees
For most automated strategies, percentage-based sizing is preferable because it adapts to account size changes and makes risk calculations consistent regardless of starting capital.
Stoploss Configuration: Calibrating to Volatility
The stoploss percentage is the most misconfigured parameter on most live bots. The default reflex is to set it tight, thinking that limits risk — but a stoploss narrower than the asset's normal noise just produces a steady drip of small losses on trades that would otherwise have recovered.
Consider a pair that fluctuates ±2% intraday on quiet days. A -1% stoploss triggers constantly, not because the strategy is wrong, but because the floor sits inside the noise. You pay maker/taker fees on the exit and the re-entry, and the losses compound through cumulative spread drag.
A defensible heuristic: stoploss width should be at least 1.5–2× the asset's typical intraday range. The Average True Range (ATR) indicator measures exactly this — and a dedicated ATR stop-loss strategy guide walks through the formula and the multiplier choice in detail.
Read the asset's recent 14-period ATR as a percent of price. If ATR sits at 3%, a -5% to -7% stoploss gives trades room to breathe through normal volatility without exposing you to catastrophic single-trade losses.
The opposite mistake is just as costly. A -25% stoploss accepts a quarter of the stake as worst case, which then requires a +33% recovery on the next trade just to break even. Wide stops also delay the moment a strategy concedes its thesis was wrong, leaving correlated positions exposed for longer.
The target zone for most medium-term bot strategies: somewhere between -3% and -10%, calibrated per pair to ATR rather than picked from a round number.
Validating Risk Parameters Before Going Live
The danger with risk parameters is that they're easy to backtest-optimize into uselessness. If you run a backtest and tune stoploss to minimize drawdown on that specific dataset, you've overfit to historical noise. The next month's data will behave differently.
VolatiCloud's backtest suite lets you test different stake and stoploss combinations across historical data to see how each configuration performed. But the more powerful validation tool is Monte Carlo simulation.
Instead of treating your backtest result as a single definitive outcome, Monte Carlo randomly shuffles the sequence of your historical trades thousands of times and measures the distribution of outcomes. This answers the question: "What's my worst-case drawdown if the same trades happened in a different order?"
If your backtest shows a 15% max drawdown but Monte Carlo's 5th percentile shows a 40% drawdown, your strategy's real-world risk is closer to 40%. The historical sequence happened to be favorable; the shuffled runs reveal the underlying fragility.
From the Monte Carlo results, look at:
- 95th percentile drawdown — the worst outcome you should plan for
- Return distribution width — wide distributions signal fragile strategies that depend on favorable trade ordering
- Ruin probability — what percentage of simulations result in a drawdown exceeding your tolerance threshold
Similarly, VolatiCloud's hyperparameter optimization can search over ranges of stoploss and stake parameters to find combinations that perform well across multiple backtest periods — helping you distinguish genuine robustness from overfitting to a single date range.
Max Open Trades and Correlation Risk
max_open_trades controls how many positions run simultaneously. Higher values spread risk across more trades; lower values concentrate it.
The catch: if you're trading multiple pairs on the same exchange (e.g., BTC/USDT and ETH/USDT), those positions are often correlated. When Bitcoin drops 10%, altcoins usually follow. Having 10 open trades across correlated pairs provides much less diversification than it appears.
For genuine diversification:
- Trade across multiple asset classes when possible (not just crypto)
- On crypto-only strategies, mixing BTC-dominated pairs with stablecoin pairs or DeFi tokens reduces correlation
- Or simply accept the correlation and size each position smaller to account for it
A practical setting for most single-exchange crypto bots: 3–8 max open trades, with position sizes set so the total deployed capital stays between 30–60% of balance. This leaves headroom for adding to positions and avoids being fully exposed during sudden market drops.
Correlations that seem moderate in normal markets spike toward 1.0 during crashes. Your 10-trade diversified portfolio becomes a single concentrated bet on "crypto goes up" precisely when you need diversification most. Keep this in mind when setting maximum exposure.
Walk-Forward Validation of Risk Settings
Once you've settled on risk parameters, test them using walk-forward analysis:
- Choose a 12-month historical period
- Optimize your parameters on the first 8 months (in-sample)
- Run your strategy with those parameters on the remaining 4 months (out-of-sample) — no adjustments
- If performance degrades significantly on the out-of-sample period, your parameters are overfit
Repeat this with multiple rolling windows. If your risk parameters consistently produce similar results across different time windows, they're likely capturing something real rather than historical noise.
This is more work than a single backtest, but it's the minimum validation threshold before running a strategy live.
Common Risk Management Mistakes
Using a fixed fraction of balance as a starting point, then not adjusting after losses. If you start with 10% per trade and take three consecutive -8% losses, your account is down ~23%. At that point, 10% of the reduced balance is still 10% — the self-adjusting property handles this naturally, but only if you're using percentage-based sizing.
Optimizing stoploss specifically to minimize backtest drawdown. This almost always overfit to the test period. A stoploss that made historical data look clean will get triggered repeatedly on live data.
Ignoring fees when calculating position sizes. On high-frequency strategies, fees can consume a significant portion of gains. If you're trading with a 0.1% maker/taker fee and targeting 0.5% gains, fees represent 40% of your profit. Factor this into position sizing.
Setting max_open_trades to unlimited. This removes a key safety ceiling. Always cap total simultaneous positions.
Skipping paper trading before going live. Your risk parameters may be correct in backtests but behave unexpectedly with live market data, order slippage, and exchange latency. VolatiCloud supports paper trading mode — run your configured bot against live market data without real orders for at least a week before switching to live execution.
Building Risk Into Your Strategy From the Start
The cleanest approach: define your acceptable maximum drawdown first, then work backward to the position size and stoploss that can produce it.
If you can tolerate a 20% drawdown on your trading account:
- Use Monte Carlo to find the stoploss / stake combination whose 95th percentile drawdown stays under 20%
- Backtest to confirm the strategy is still profitable within those constraints
- Walk-forward validate to check robustness
This is the opposite of the common pattern (optimize for returns, hope the drawdown is acceptable). Starting from your risk tolerance and working backward leads to strategies that survive.
VolatiCloud's backtesting, Monte Carlo simulation, and hyperparameter optimization tools give you the quantitative foundation to validate risk parameters before committing real capital. Start your 7-day free Pro trial at console.volaticloud.com and run your first risk analysis on a strategy you already trust.
For related reading, see Monte Carlo simulation for trading bots, hyperparameter optimization, and the paper-trading-to-live framework for the validation gate after risk parameters are settled.