Chart-Native Strategy Studio: See Your Trading Rules Fire Before You Backtest

Building a rule in a no-code strategy builder has always meant working blind: you set RSI(14) < 30, save, and hope. The only way to know whether that rule does anything sensible was to run a full backtest and dig through a trade list afterward. VolatiCloud's Strategy Studio just closed that gap — every condition you build now renders live on the candlestick chart while you're still editing it.
The Problem: Building Rules You Can't See
A rule-based strategy is a sequence of abstractions — indicators, comparisons, boolean logic — that only becomes concrete once a backtest engine runs it against real candles. Between "I wrote this condition" and "here's what it actually does," there used to be a full backtest cycle: pick a date range, wait for the run, open the results, scroll to trades, and mentally map each trade back to the rule that produced it.
That gap causes two kinds of mistakes. First-time builders write conditions that are structurally valid but numerically nonsensical — RSI < 304 compiles and runs without complaint, it just never fires, because RSI never exceeds 100. Experienced builders make subtler errors: an AND where they meant OR, a comparison operator flipped, an offset that references the wrong candle. Both classes of mistake are invisible until a backtest — sometimes a slow one — finally surfaces them.
Live Signal Preview: One Engine, Rendered on the Chart
The Strategy Studio now runs a lightweight, client-side evaluator against your condition tree the moment you finish typing. It walks every cached candle, computes the same indicator series the chart already draws, and marks the exact bars where your rule would have fired — without touching the backtest engine at all.
The result shows up directly on the chart you're already looking at:
- Ghost markers — translucent arrows at the candles where your entry condition evaluates true, so you see the actual firing pattern instead of imagining it
- Threshold guide lines — dashed reference lines drawn at the constants your rule compares against (RSI's 30/70, a price level, a Bollinger Band edge) directly on the relevant pane
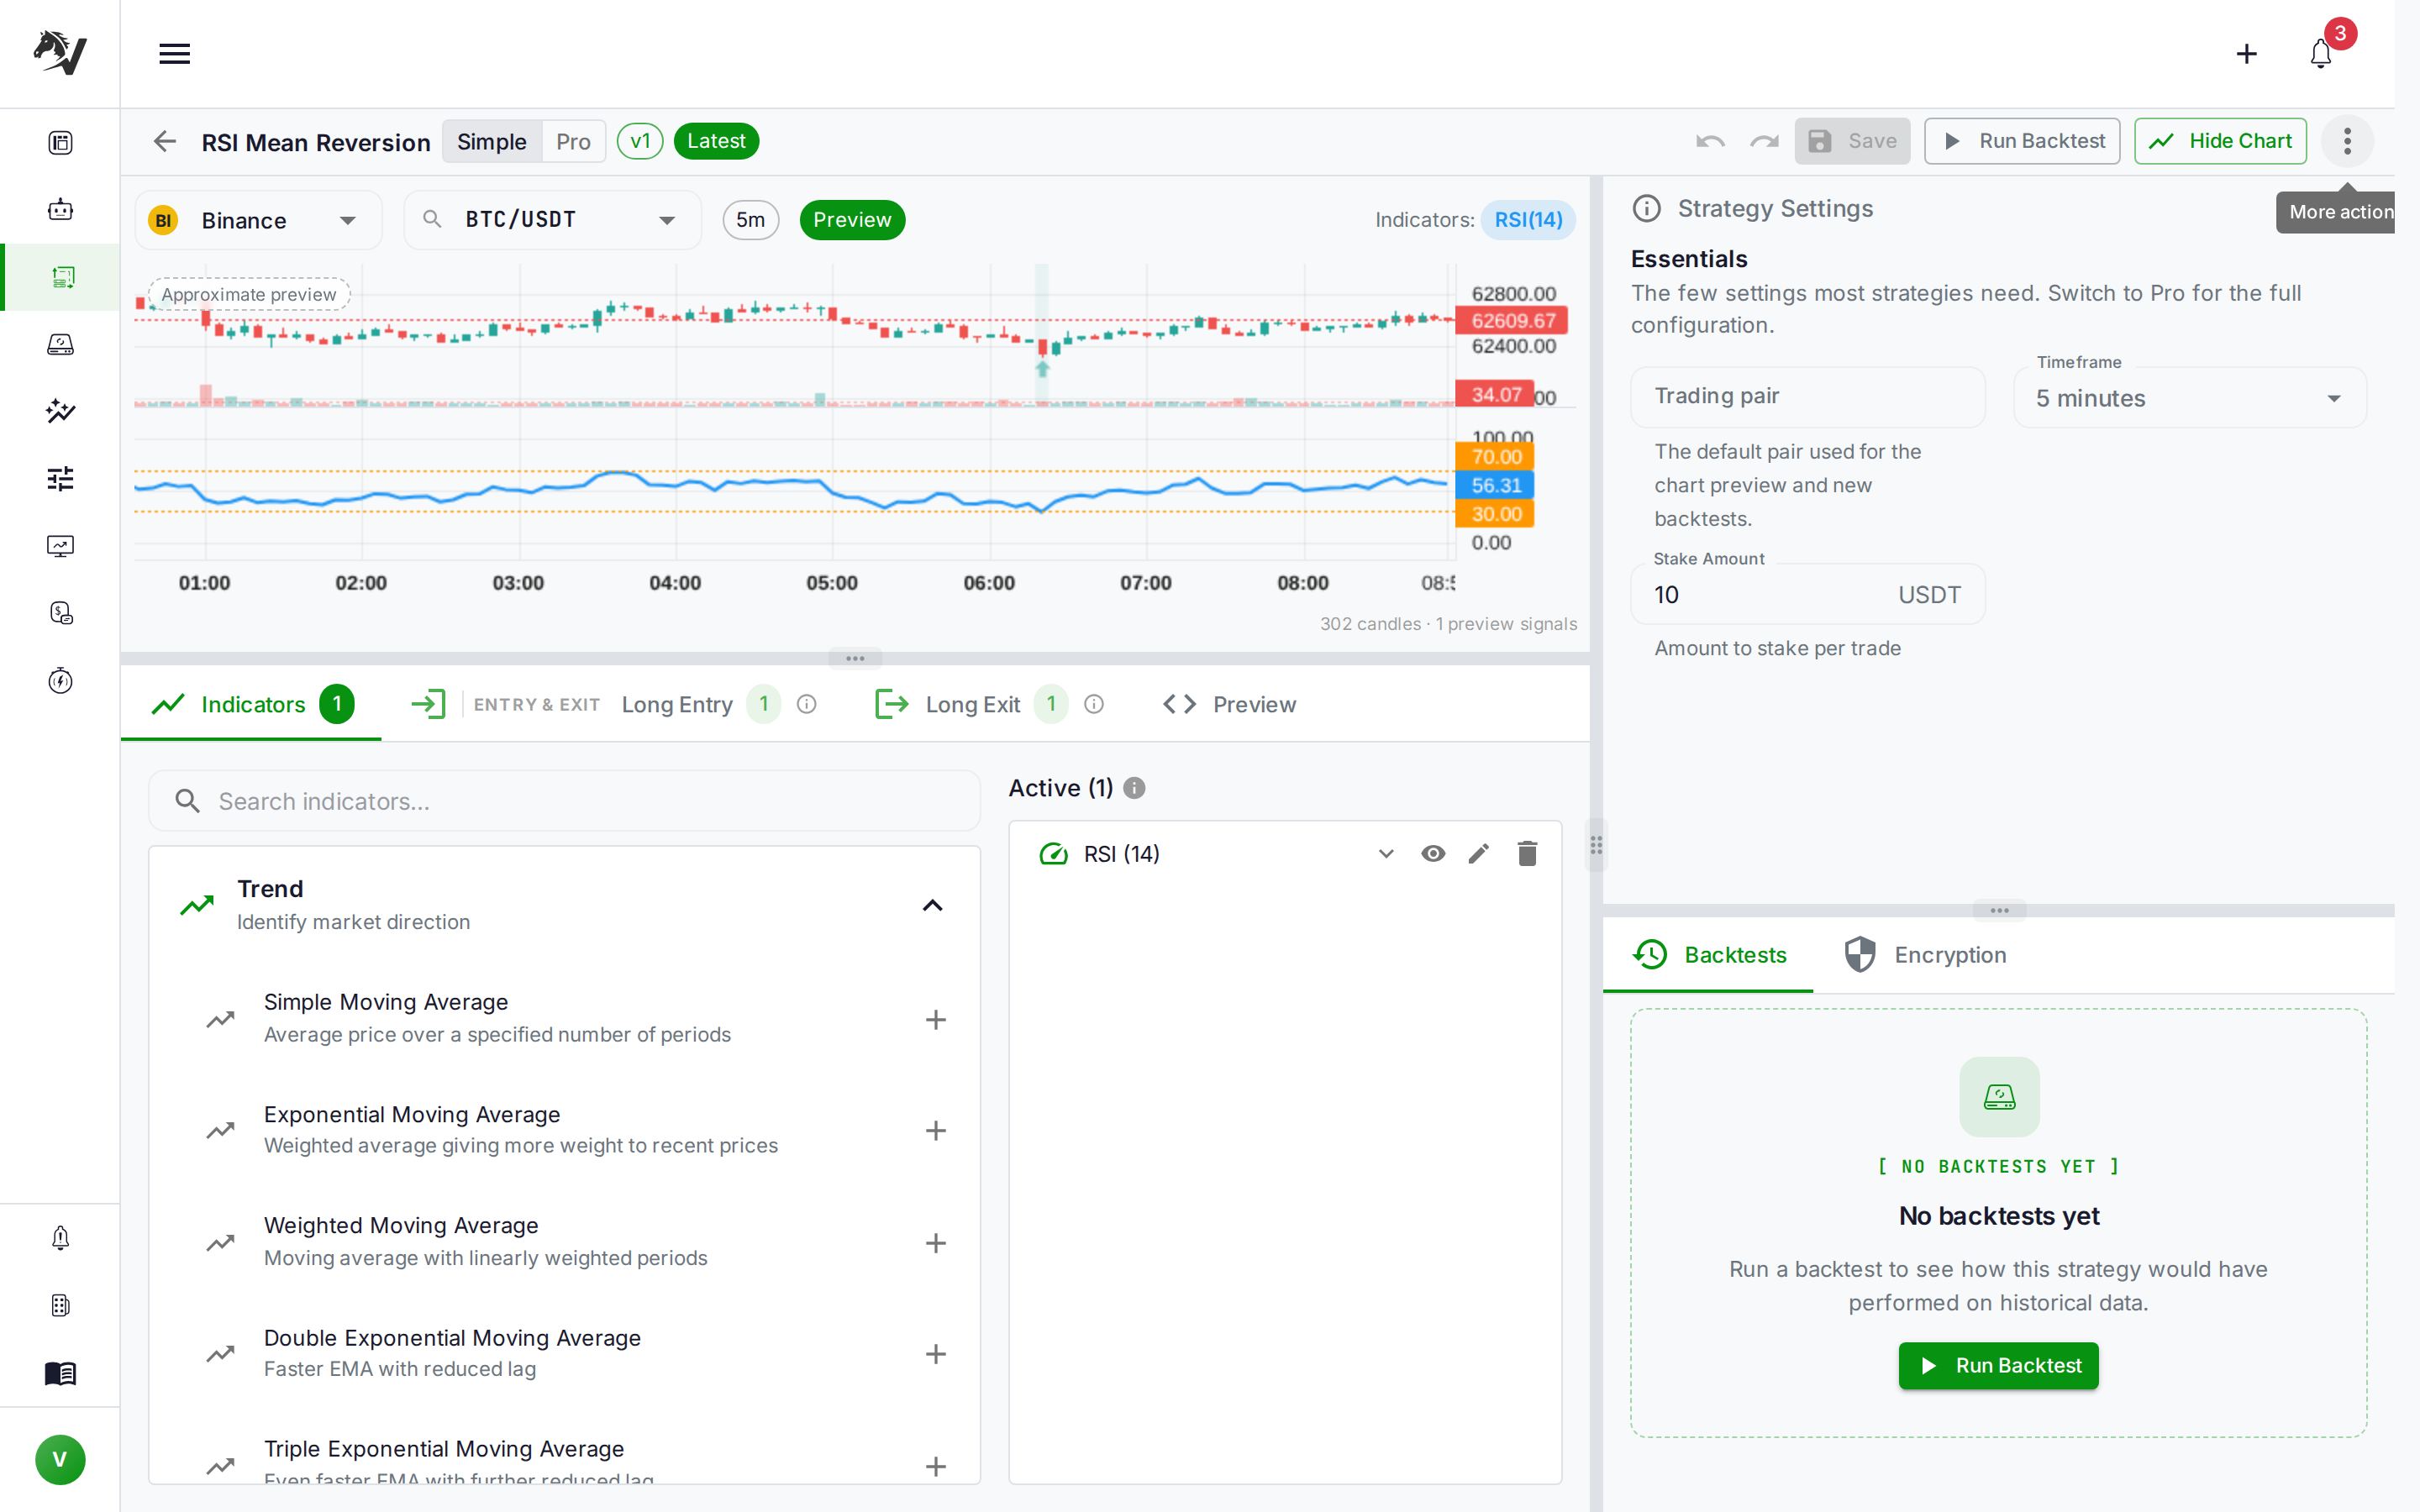
- An honest "Approximate preview" badge — client-side math isn't bit-for-bit identical to the Freqtrade backtest engine, and the Studio says so rather than implying false precision
In the screenshot above, the RSI Mean Reversion strategy's oscillator pane shows the 30 and 70 threshold lines exactly where you'd expect, and the price pane marks the single candle where RSI dipped under 30 during the loaded window. No backtest was run to produce that — it's a live read of the condition tree.
The preview is deliberately conservative about what it claims. Conditions that depend on data the client can't reconstruct (trade context, external signals) show a "requires backtest" notice instead of a guessed marker. A wrong-but-confident preview would be worse than no preview at all.
From Rule to Chart, Directly
The clearest version of this connection shows up on the condition tabs themselves. Switch to the Long Entry tab for the same strategy, and the plain-English summary, the condition builder, and the chart above it all describe the same rule from three angles at once:
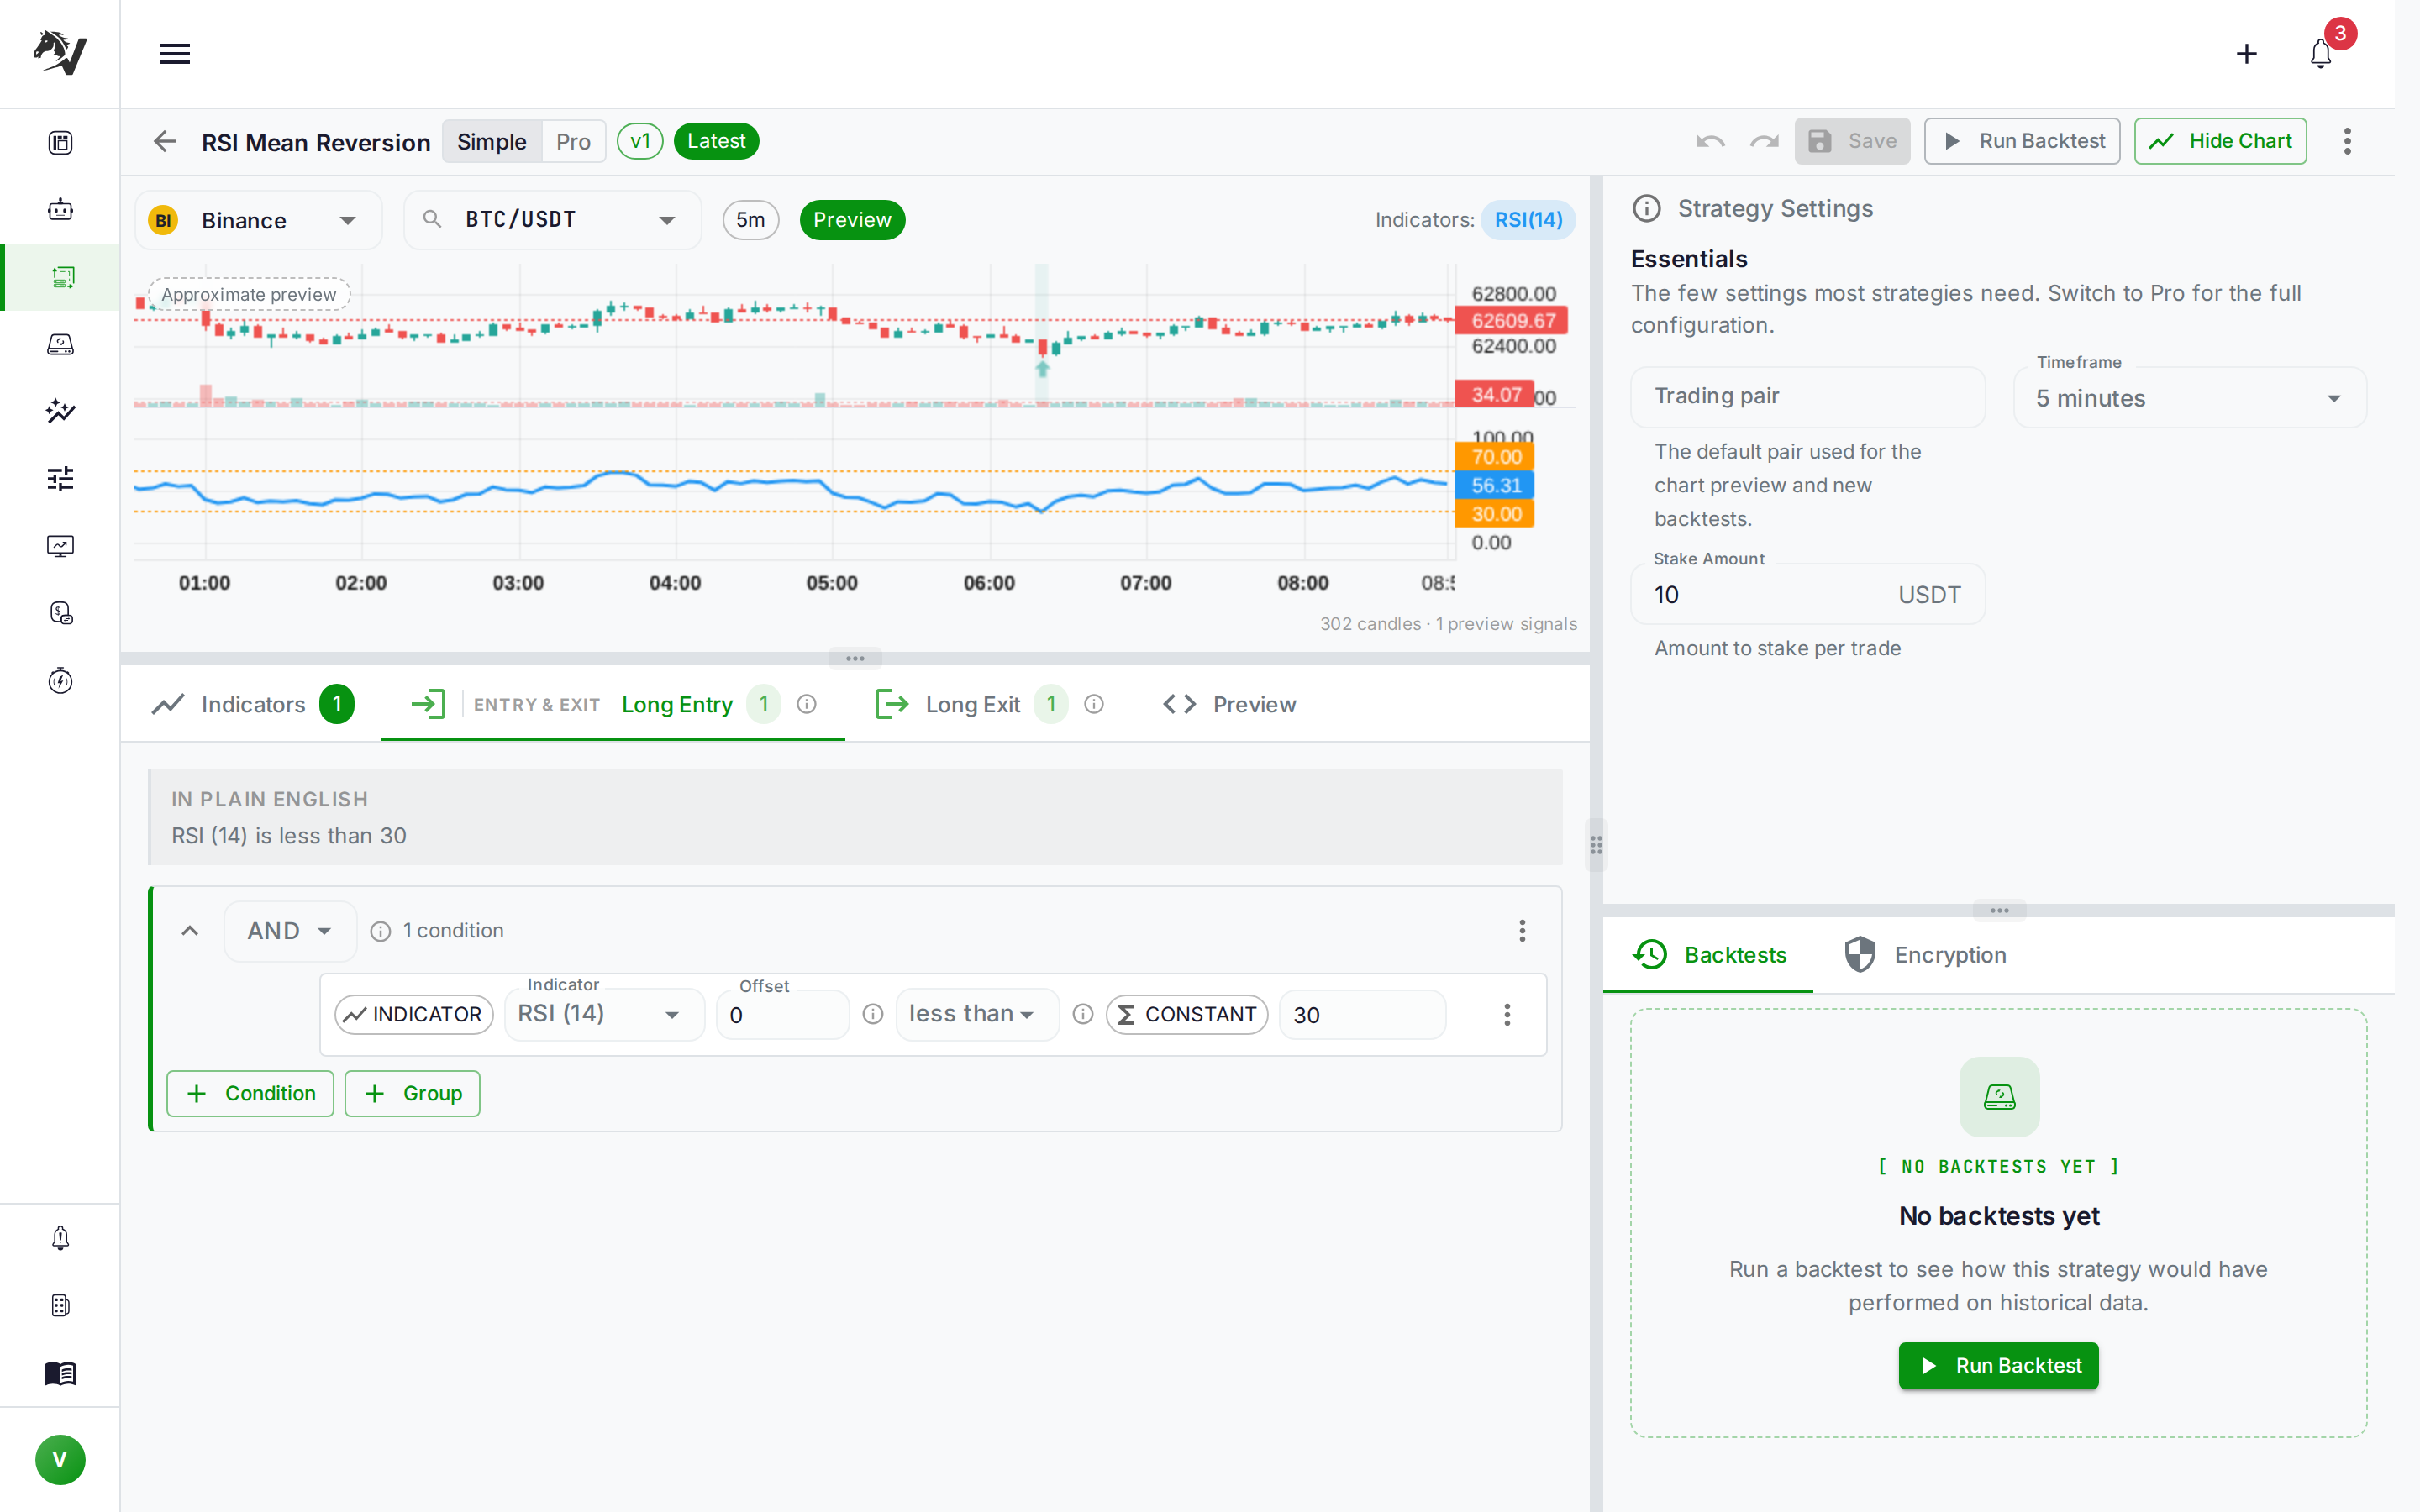
"RSI (14) is less than 30" is the plain-English translation, the INDICATOR / less than / CONSTANT 30 row is the structured rule, and the orange dashed line at 30.00 with a marker where price actually crossed it is the visual proof. Change the constant from 30 to 25 and the guide line — and the set of ghost markers — updates within a few hundred milliseconds. You don't have to imagine what a looser or tighter threshold does; you watch it happen.
This closes a specific gap for two different builders. A first-time trader gets instant, honest feedback on whether a rule does anything at all — VolatiCloud's strategy template gallery already gets people started with vetted logic, and the live preview now confirms it's behaving as advertised before a single backtest runs. A trader tuning an existing strategy — someone working through the ideas in avoiding overfitting or refining an RSI mean-reversion setup — gets a tight edit-and-observe loop instead of a queue of backtests just to check whether a tweak changed anything.
Sanity Rails Catch Nonsense Before You Save
The same engine that draws threshold guides also knows the valid range for every indicator it renders. RSI, Stochastic, and MFI are bounded 0–100; Williams %R runs −100 to 0; CMF sits between −1 and 1. When a constant falls outside an indicator's real range, the Studio flags it inline — a warning-toned hint under the field suggesting the likely fix ("RSI is 0–100 — did you mean 30.4?") rather than silently accepting a comparison that can never be true.
It's a non-blocking warning, not a hard validation error — there are legitimate reasons to write a condition that never fires in the current window (a rule intended for a different market regime, for example). But for the much more common case of a typo or a decimal-point slip, catching it before a wasted backtest run saves real time, especially on longer backtests over multi-year data.
Draggable Thresholds for Fast Iteration
Threshold guide lines aren't just read-only reference marks — they're grab handles. Hover over a threshold line and the cursor shows a drag affordance; pull it up or down and the constant in your condition tree updates in real time, with the ghost markers reflowing live as you drag. Release, and the change collapses into a single undo step, so experimenting with a tighter or looser RSI band doesn't fragment your edit history into a dozen tiny steps.
Precision typing into the constant field still works exactly as before — dragging is an additive way to explore a range quickly, not a replacement for exact values when you already know the number you want.
Beyond the Chart: Explainability and RL Visibility
The chart-native work extends past the signal preview. Once a real backtest runs, every trade now carries an enter_tag identifying which specific branch of your condition tree produced it — click a trade marker on the chart and the Studio highlights the exact rule that fired, jumps to that tab, and shows a per-branch performance breakdown (win rate and profit, split out by which condition branch generated each trade). If your strategy has three OR'd entry conditions and one of them is bleeding money while the other two are profitable, that's now visible in one panel instead of buried in an exported trade CSV.
For reinforcement-learning strategies, the same chart gets RL-specific treatment: agent actions render as chips on the trade markers, and training/test window boundaries shade directly on the price pane so you can see exactly which candles the agent trained on versus which it was evaluated against. Pairs well with the "Shape your agent" behavior sliders — three plain-language controls (risk appetite, trade frequency, hold patience) that reshape the underlying reward function without touching a reward-expression editor, for traders exploring reinforcement learning strategies without wanting to hand-write Python reward terms.
Getting Started
The live preview is on by default for every rule-based strategy in the Studio — there's no setting to enable. Open any strategy with at least one indicator and one condition, and the chart above the builder starts rendering ghost markers and threshold guides as soon as the condition tree has enough information to evaluate.
If you're building a new strategy from scratch, the Visual Strategy Builder walkthrough and the UI Builder documentation cover the full indicator and condition workflow this preview sits on top of. Once your rule looks right on the chart, the natural next step is still a full backtest — the preview tells you your logic does what you think; the backtest tells you whether that logic makes money.
Open the Strategy Studio on an existing strategy and watch your own rules light up on the chart — it's the fastest way to catch a condition that looks right on paper but never actually fires.