VolatiCloud Strategy Builder: Step-by-Step Walkthrough

Most traders can articulate their strategy in plain English: "buy when the trend is up, momentum is building, but the market isn't yet overbought." Converting that into a running bot is where most people get stuck — not because the idea is wrong, but because turning mental rules into executable code requires a skill set that has nothing to do with trading.
This walkthrough builds a complete three-indicator confluence strategy using VolatiCloud's visual editor — from blank canvas to deployable bot — without writing a single line of code.
The Strategy We're Building
Before touching any UI, define what you want to trade:
| Component | Rule |
|---|---|
| Trend filter | EMA(50) is above EMA(200) — the market is in a bullish structure |
| Momentum signal | MACD line crosses above the signal line — momentum is shifting up |
| Momentum zone | RSI(14) is between 45 and 65 — confirms buying pressure without being overbought |
| Exit | RSI(14) exceeds 70 OR MACD line crosses back below the signal |
| Stop-loss | 5% fixed |
| Timeframe | 1h |
Three conditions that must all be true simultaneously — an AND gate. The entry only fires at the intersection of trend, signal, and confirmation. This layered approach reduces false entries and is straightforward to build visually.
Step 1: Create a New Strategy
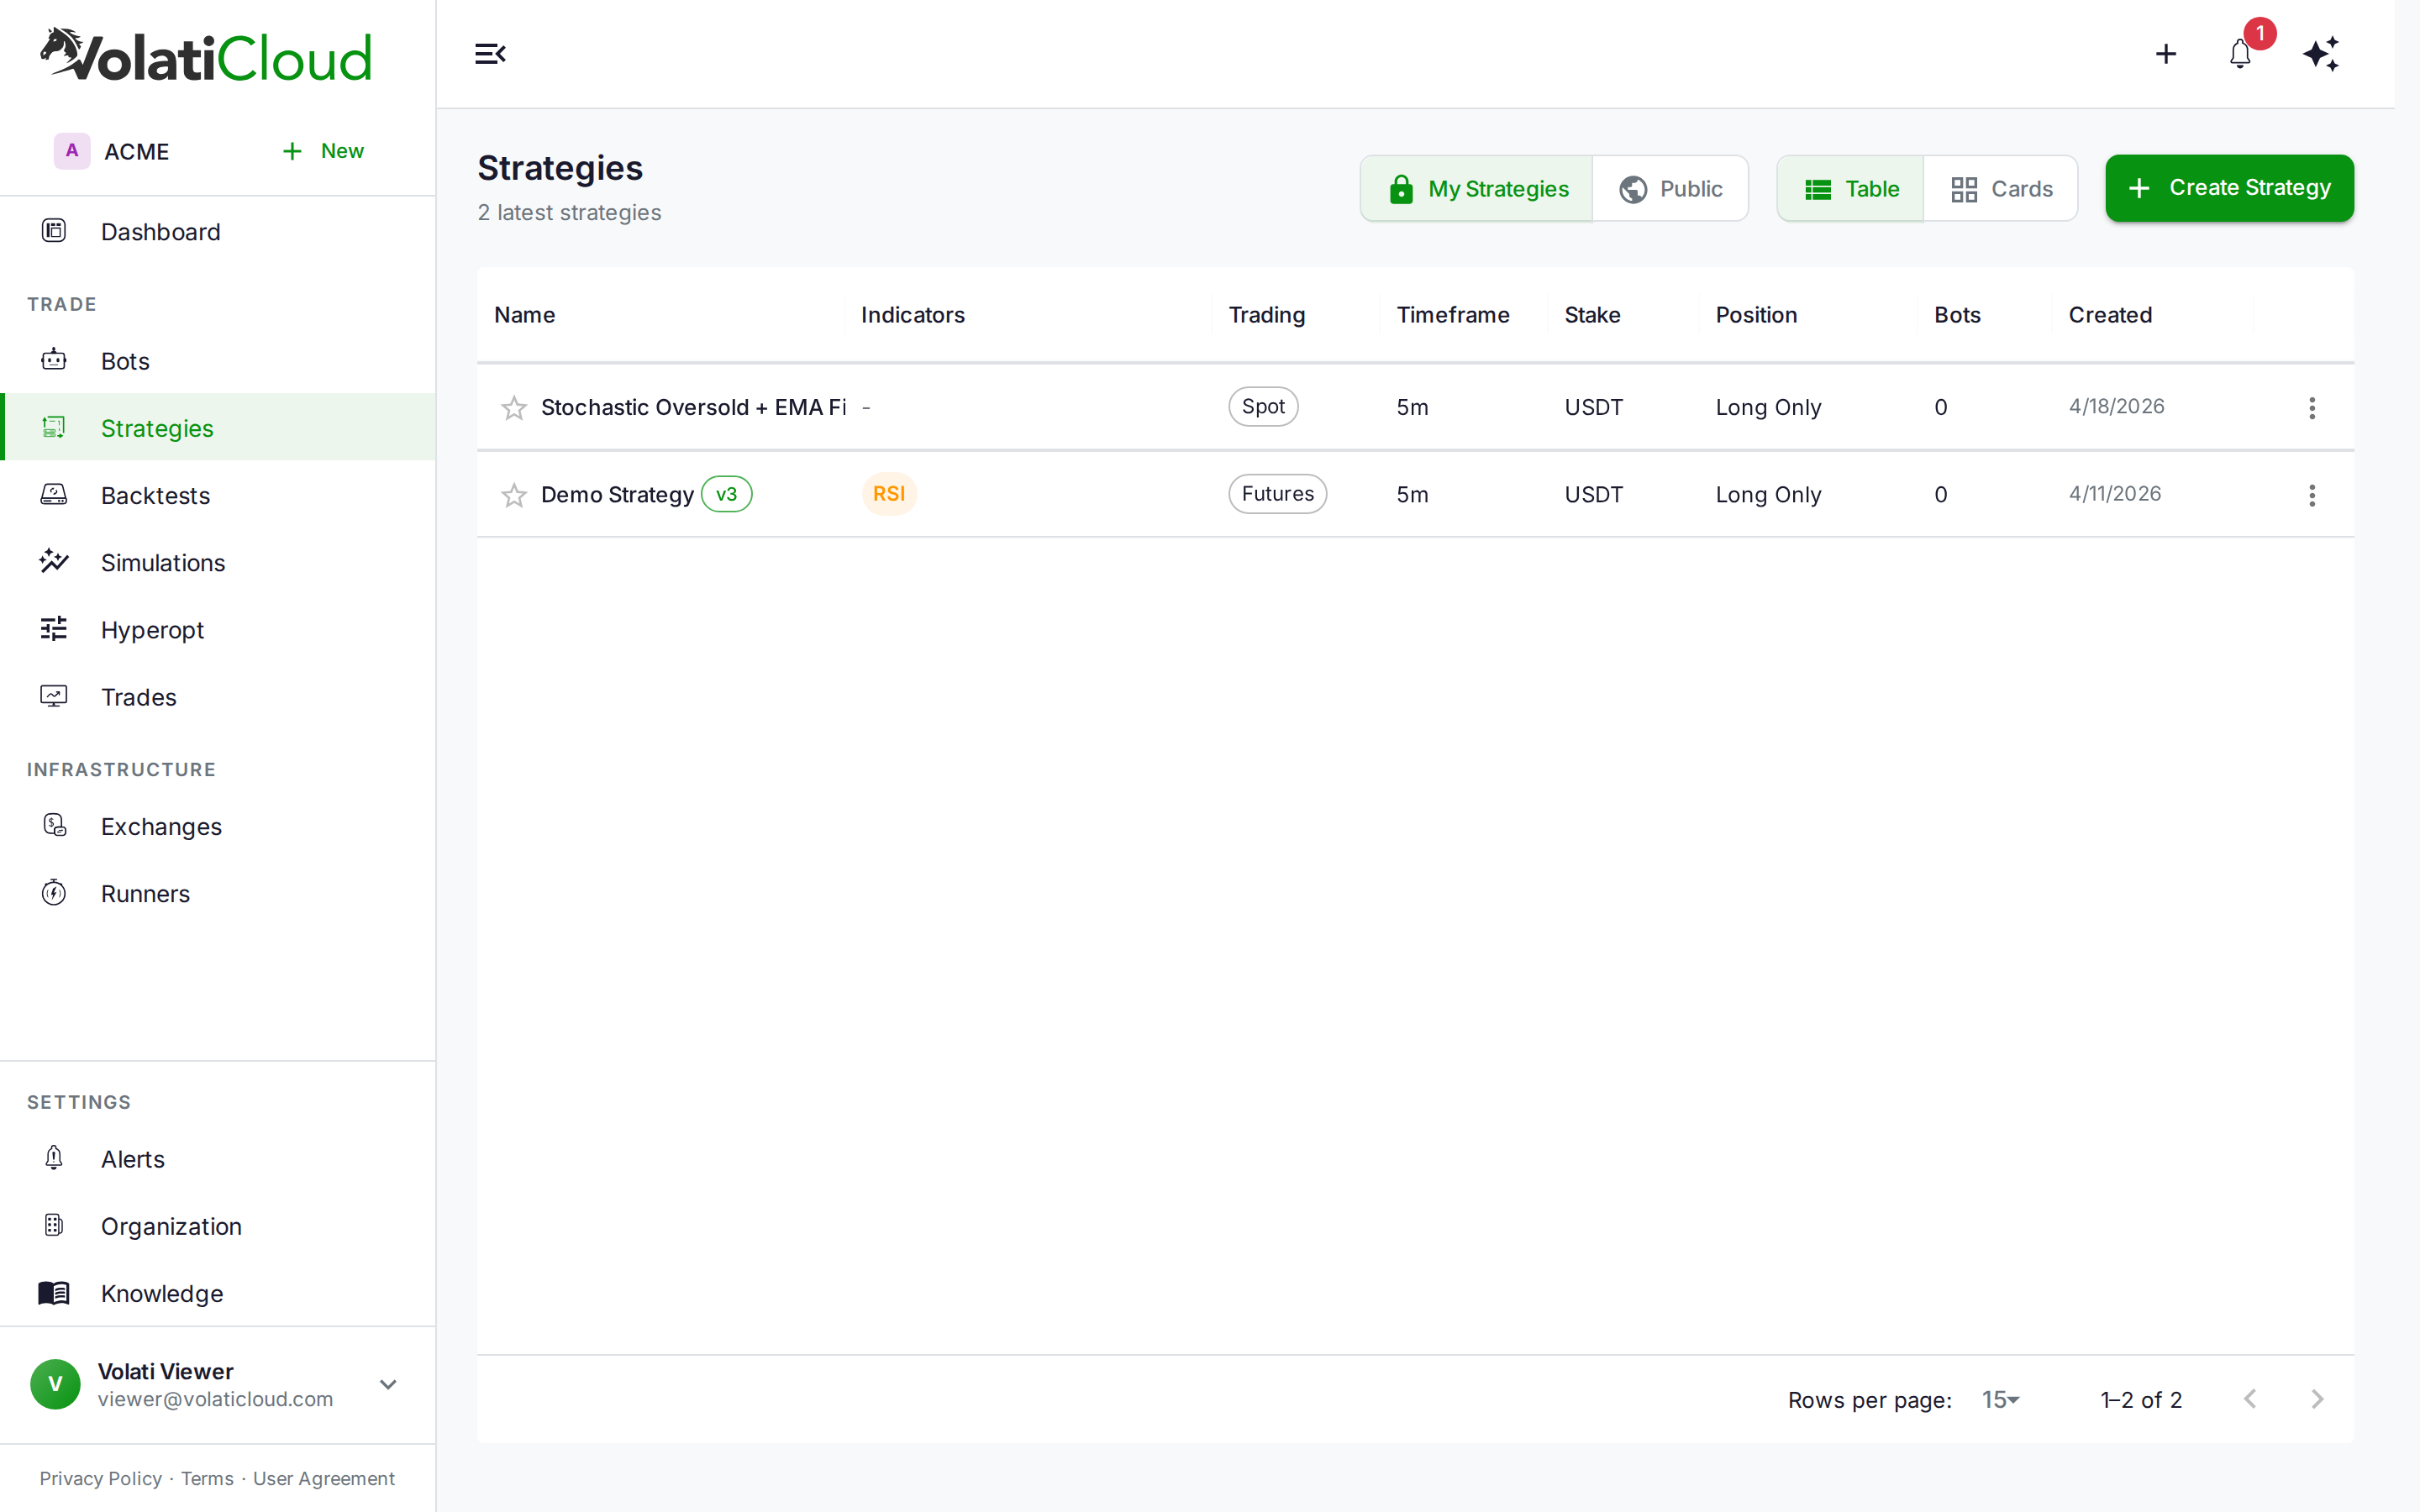
Open the Strategies page from the sidebar and click Create Strategy. A drawer slides in asking for a name and description.
Give your strategy a descriptive name — "EMA Trend + MACD Confluence" tells you exactly what you're looking at six months from now. The description is optional but useful for documenting your thesis.
Click Create. You land directly in the Strategy Studio with the Indicators tab active.
Step 2: Add Indicators to Your Workspace
The Indicators tab is your starting point. On the left is a scrollable indicator library organized into five categories:
- Trend — SMA, EMA, WMA, DEMA, TEMA, KAMA
- Momentum — RSI, MACD, Stochastic, StochRSI, Williams %R, CCI, MOM, ROC
- Volatility — Bollinger Bands, ATR, Keltner Channel
- Volume — OBV, MFI, CMF, Accumulation/Distribution
- Other — ADX, VWAP, Ichimoku, Parabolic SAR, Supertrend
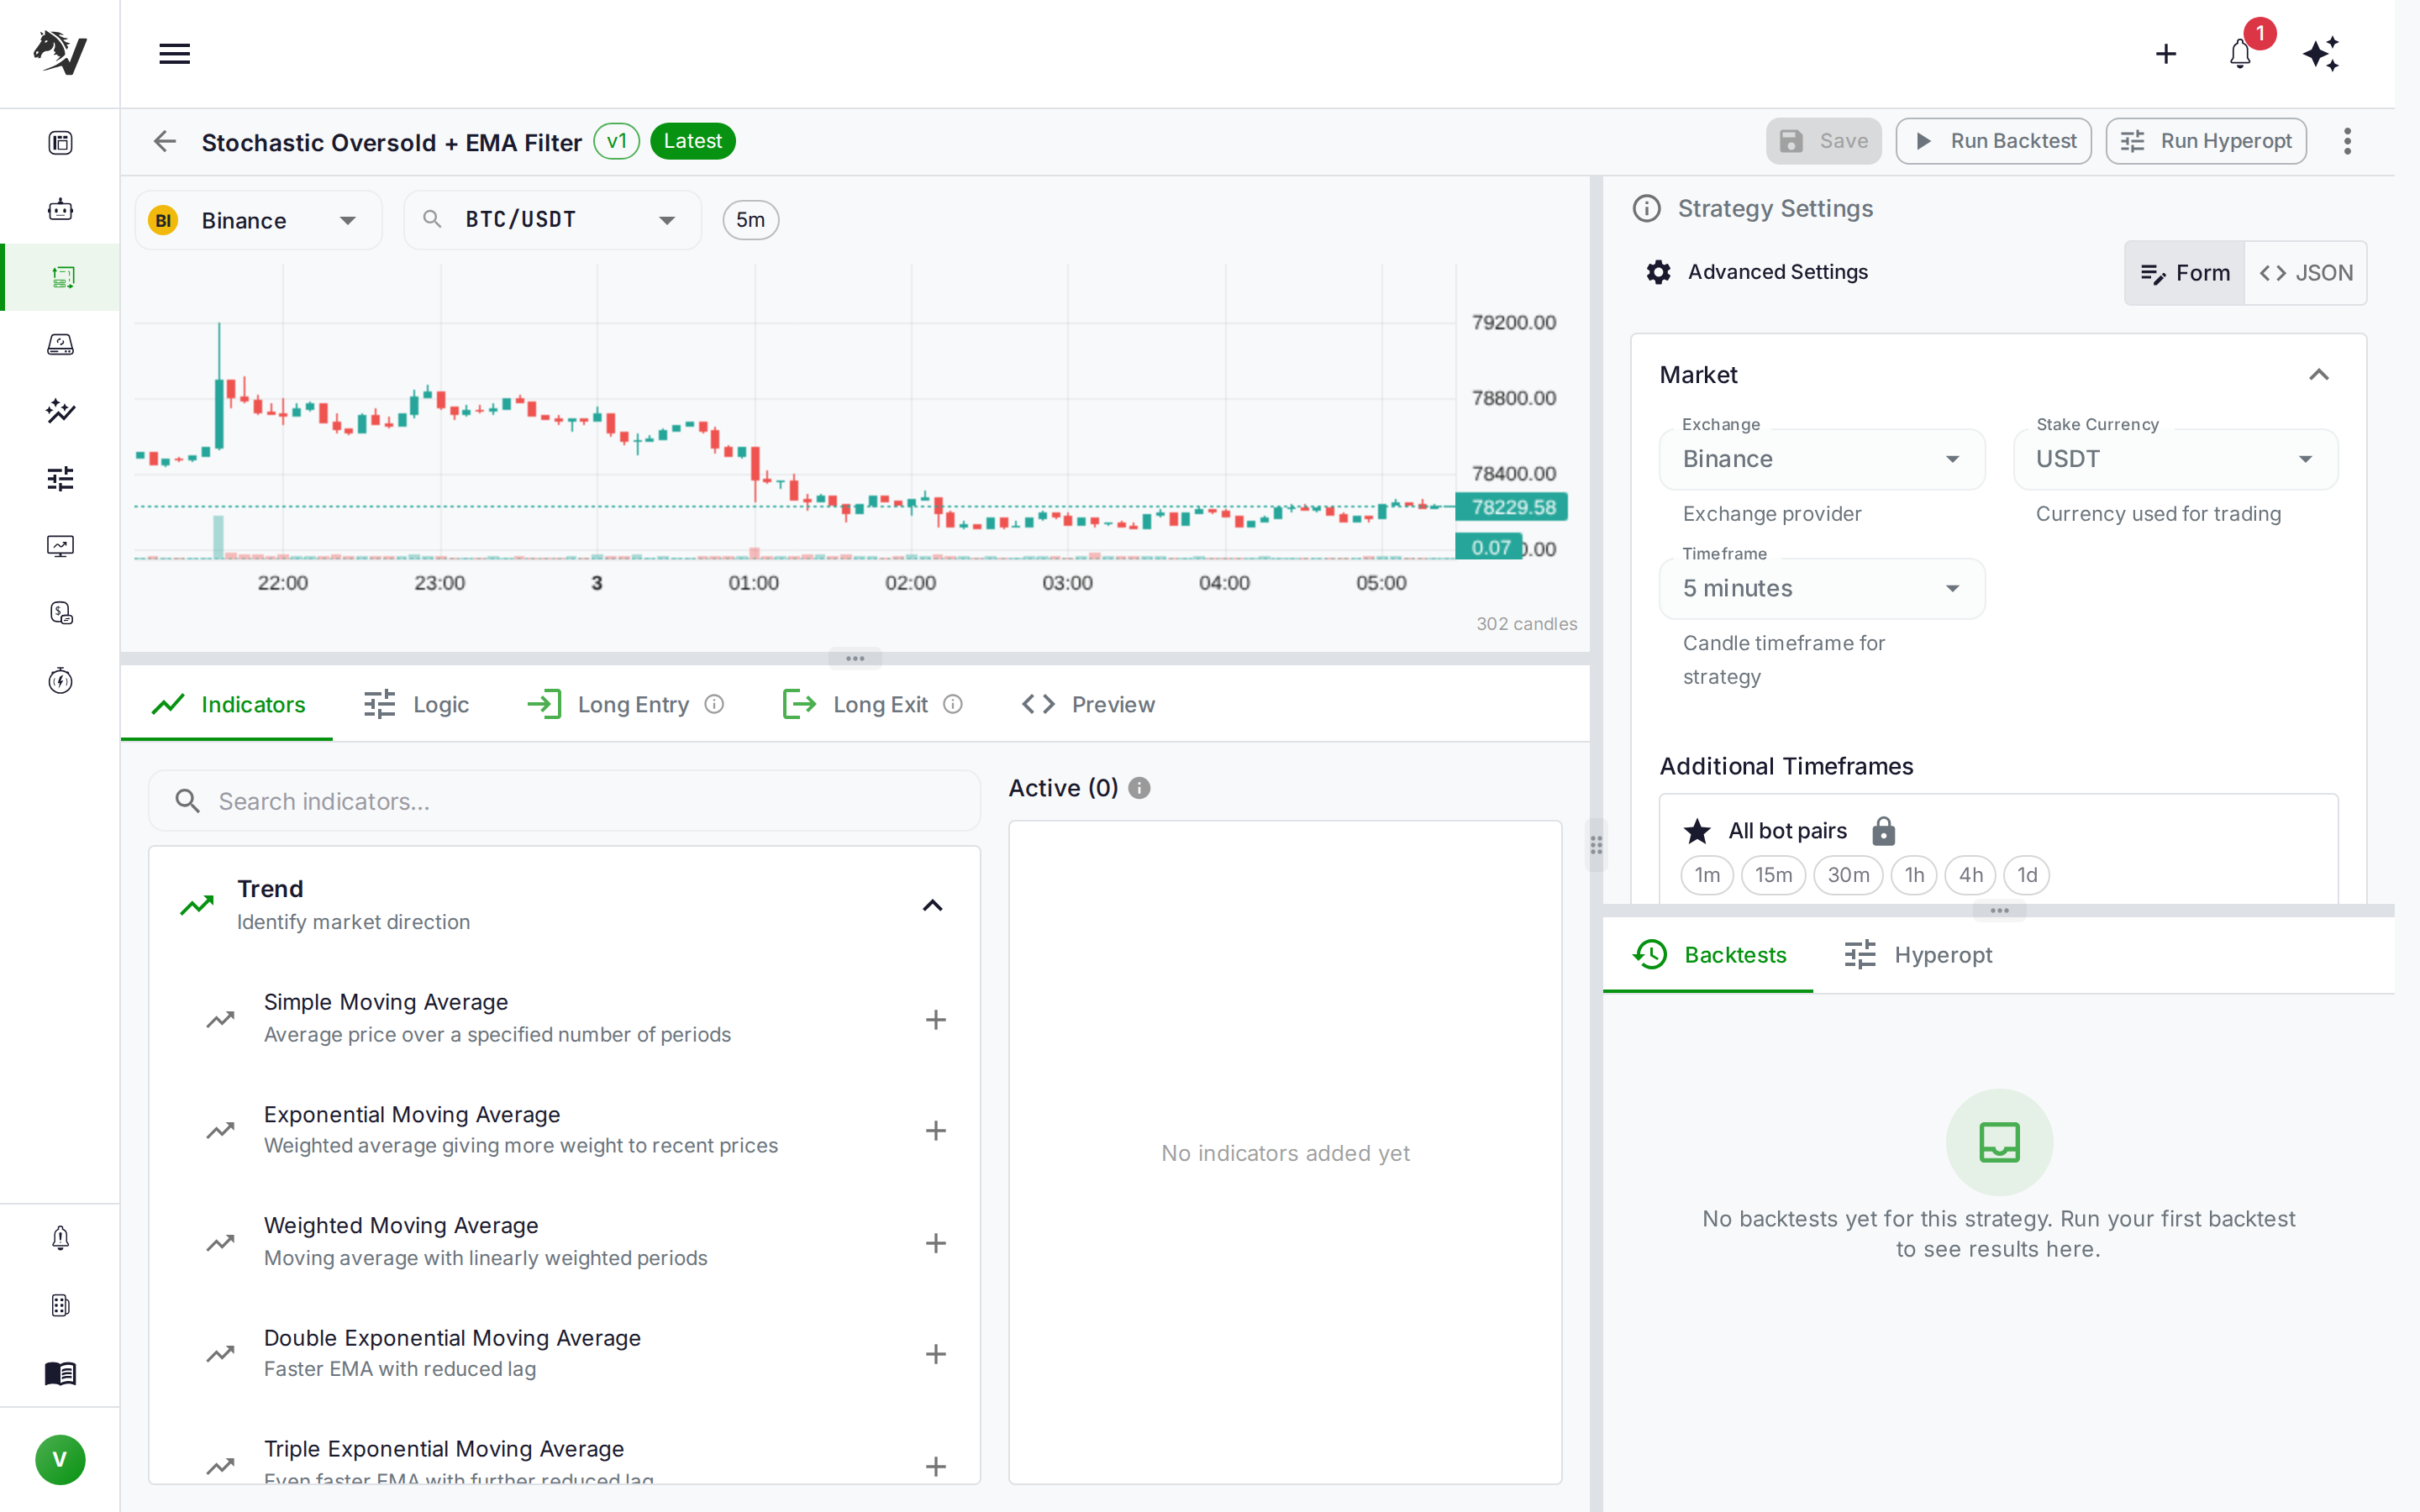
For this strategy, add four indicator series:
EMA twice — for 50 and 200 periods
Expand the Trend category, click EMA, and configure:
- Label:
EMA 50, Period:50
Add it again:
- Label:
EMA 200, Period:200
MACD
Expand Momentum, click MACD. The default parameters (fast: 12, slow: 26, signal: 9) are standard — leave them unless you have reason to change them.
RSI
Still in Momentum, click RSI:
- Label:
RSI 14, Period:14
Your workspace now has four indicator series plotted on the chart. The chart renders your pair (defaulting to BTC/USDT on Binance) with these overlaid, letting you visually verify they're computing as expected before writing a single condition.
Add indicators before building conditions. The condition builder references the indicators you've added — if an indicator isn't in your workspace, it won't appear as an operand when building entry or exit logic.
Step 3: Build Your Entry Conditions
Click the Long Entry tab. You'll see an empty condition tree with a root AND node ready to be configured.
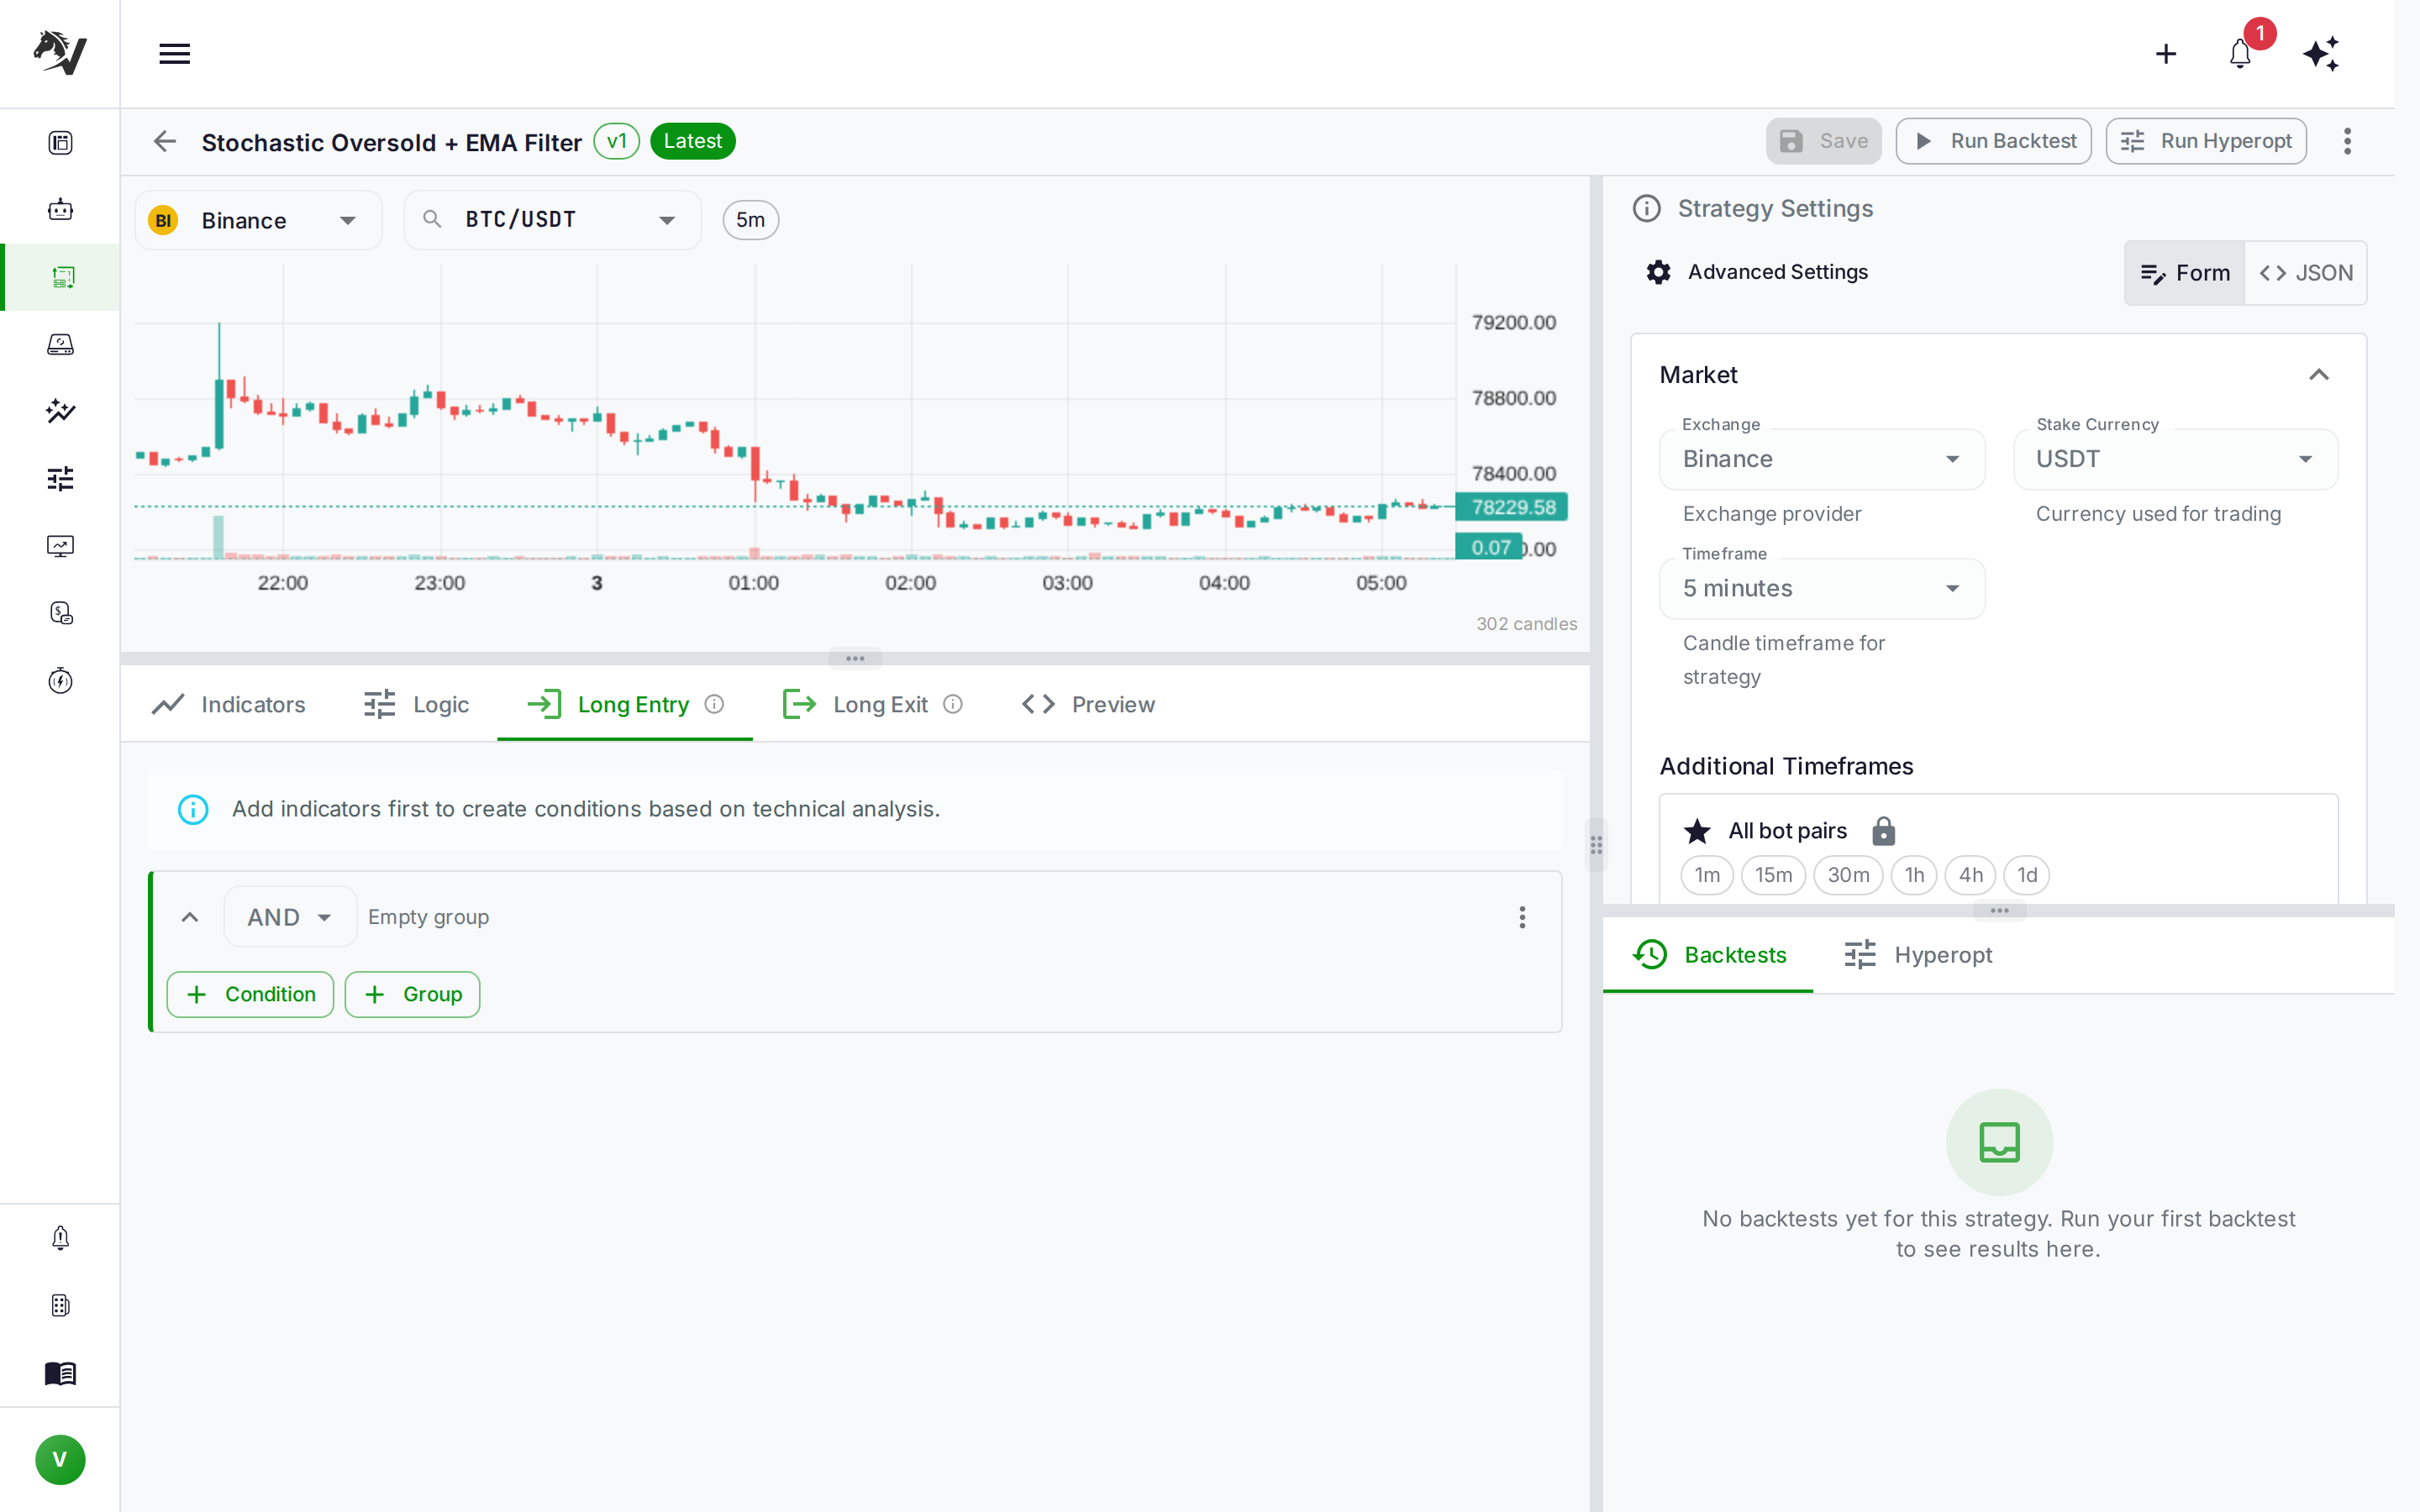
The root node: AND or OR?
Every condition tree has a root node that combines its children. For entry logic, AND is almost always the right choice at the root — all your conditions must be true at the same time for the entry to fire.
The AND root node is set by default. Now add three child conditions.
Condition 1: Trend alignment (COMPARE)
Click + Condition under the AND root. Choose COMPARE.
Configure:
- Left operand:
INDICATOR → EMA 50 - Operator:
>(greater than) - Right operand:
INDICATOR → EMA 200
This encodes: the 50-period EMA is above the 200-period EMA, a classic bullish trend condition.
Condition 2: MACD crossover (CROSSOVER)
Add another child under AND. Choose CROSSOVER.
Configure:
- Fast operand:
INDICATOR → MACD Line - Slow operand:
INDICATOR → MACD Signal
A CROSSOVER node fires true on the exact candle where the fast value crosses above the slow value. It is not the same as MACD Line > Signal Line — that comparison would be true for every candle after the cross. CROSSOVER is true only on the crossover candle itself, which gives you a single, precise entry trigger rather than a persistent green zone.
Use COMPARE when you want a condition to remain true across multiple candles (e.g., "price is above the 200 EMA while it holds above"). Use CROSSOVER when you want to trigger only at the moment the values change relationship.
Condition 3: RSI momentum zone (IN_RANGE)
Add the third child under AND. Choose IN_RANGE.
Configure:
- Value:
INDICATOR → RSI 14 - Lower bound:
45 - Upper bound:
65
IN_RANGE lets you specify a precise window of acceptable values. Here, 45–65 means the RSI is in a rising but not yet overbought zone — momentum is present, but there's still room to run. This is more useful than "RSI is below 70" (which is almost always true).
Your complete entry tree:
AND
├── COMPARE: EMA(50) > EMA(200)
├── CROSSOVER: MACD Line over MACD Signal
└── IN_RANGE: RSI(14) between 45 and 65
Step 4: Define Exit Conditions
Click the Long Exit tab. The same condition builder appears.
For exits, OR at the root makes sense — you want to exit if any of your exit signals fire, not only when all of them trigger simultaneously.
Set the root to OR and add two children:
Exit condition 1: RSI overbought (COMPARE)
- Left:
INDICATOR → RSI 14 - Operator:
> - Right:
CONSTANT → 70
Exit condition 2: MACD bearish cross (CROSSOVER)
- Fast operand:
INDICATOR → MACD Signal - Slow operand:
INDICATOR → MACD Line
Note the flip: for the exit crossover, the Signal line crosses above the MACD Line — the inverse of the entry signal.
OR
├── COMPARE: RSI(14) > 70
└── CROSSOVER: MACD Signal over MACD Line
Step 5: Configure the Logic Tab
Click the Logic tab. This is where parameters that apply to the whole strategy are set.
For this strategy:
- Position mode: Long Only (or both directions if you plan to add short conditions later)
- Stop-loss:
-5%— the slider goes from 0 to -30%; drag to -5 or type the value - Timeframe:
1h - Stake amount: Configures how much capital each bot trade uses — set according to your risk tolerance when deploying
The Logic tab also exposes Advanced Callbacks — optional Python-level hooks for custom stoploss calculations, DCA ladders, leverage strategies, and pre-entry/exit confirmation checks. For a starter strategy, leave these off. They're useful once you want to move beyond fixed-percentage stops or add position sizing logic.
Long/Short strategies get separate tabs: Long Entry/Exit and Short Entry/Exit. Enable Mirror Mode in the Logic tab to automatically invert your long conditions for shorts — CROSSOVER becomes CROSSUNDER, > becomes <. Start with longs and add shorts once the long side is validated.
Step 6: Preview and Validate the Generated Code
Click the Preview tab. The Monaco editor shows the Python code your visual configuration generated — a complete, importable Freqtrade strategy class.
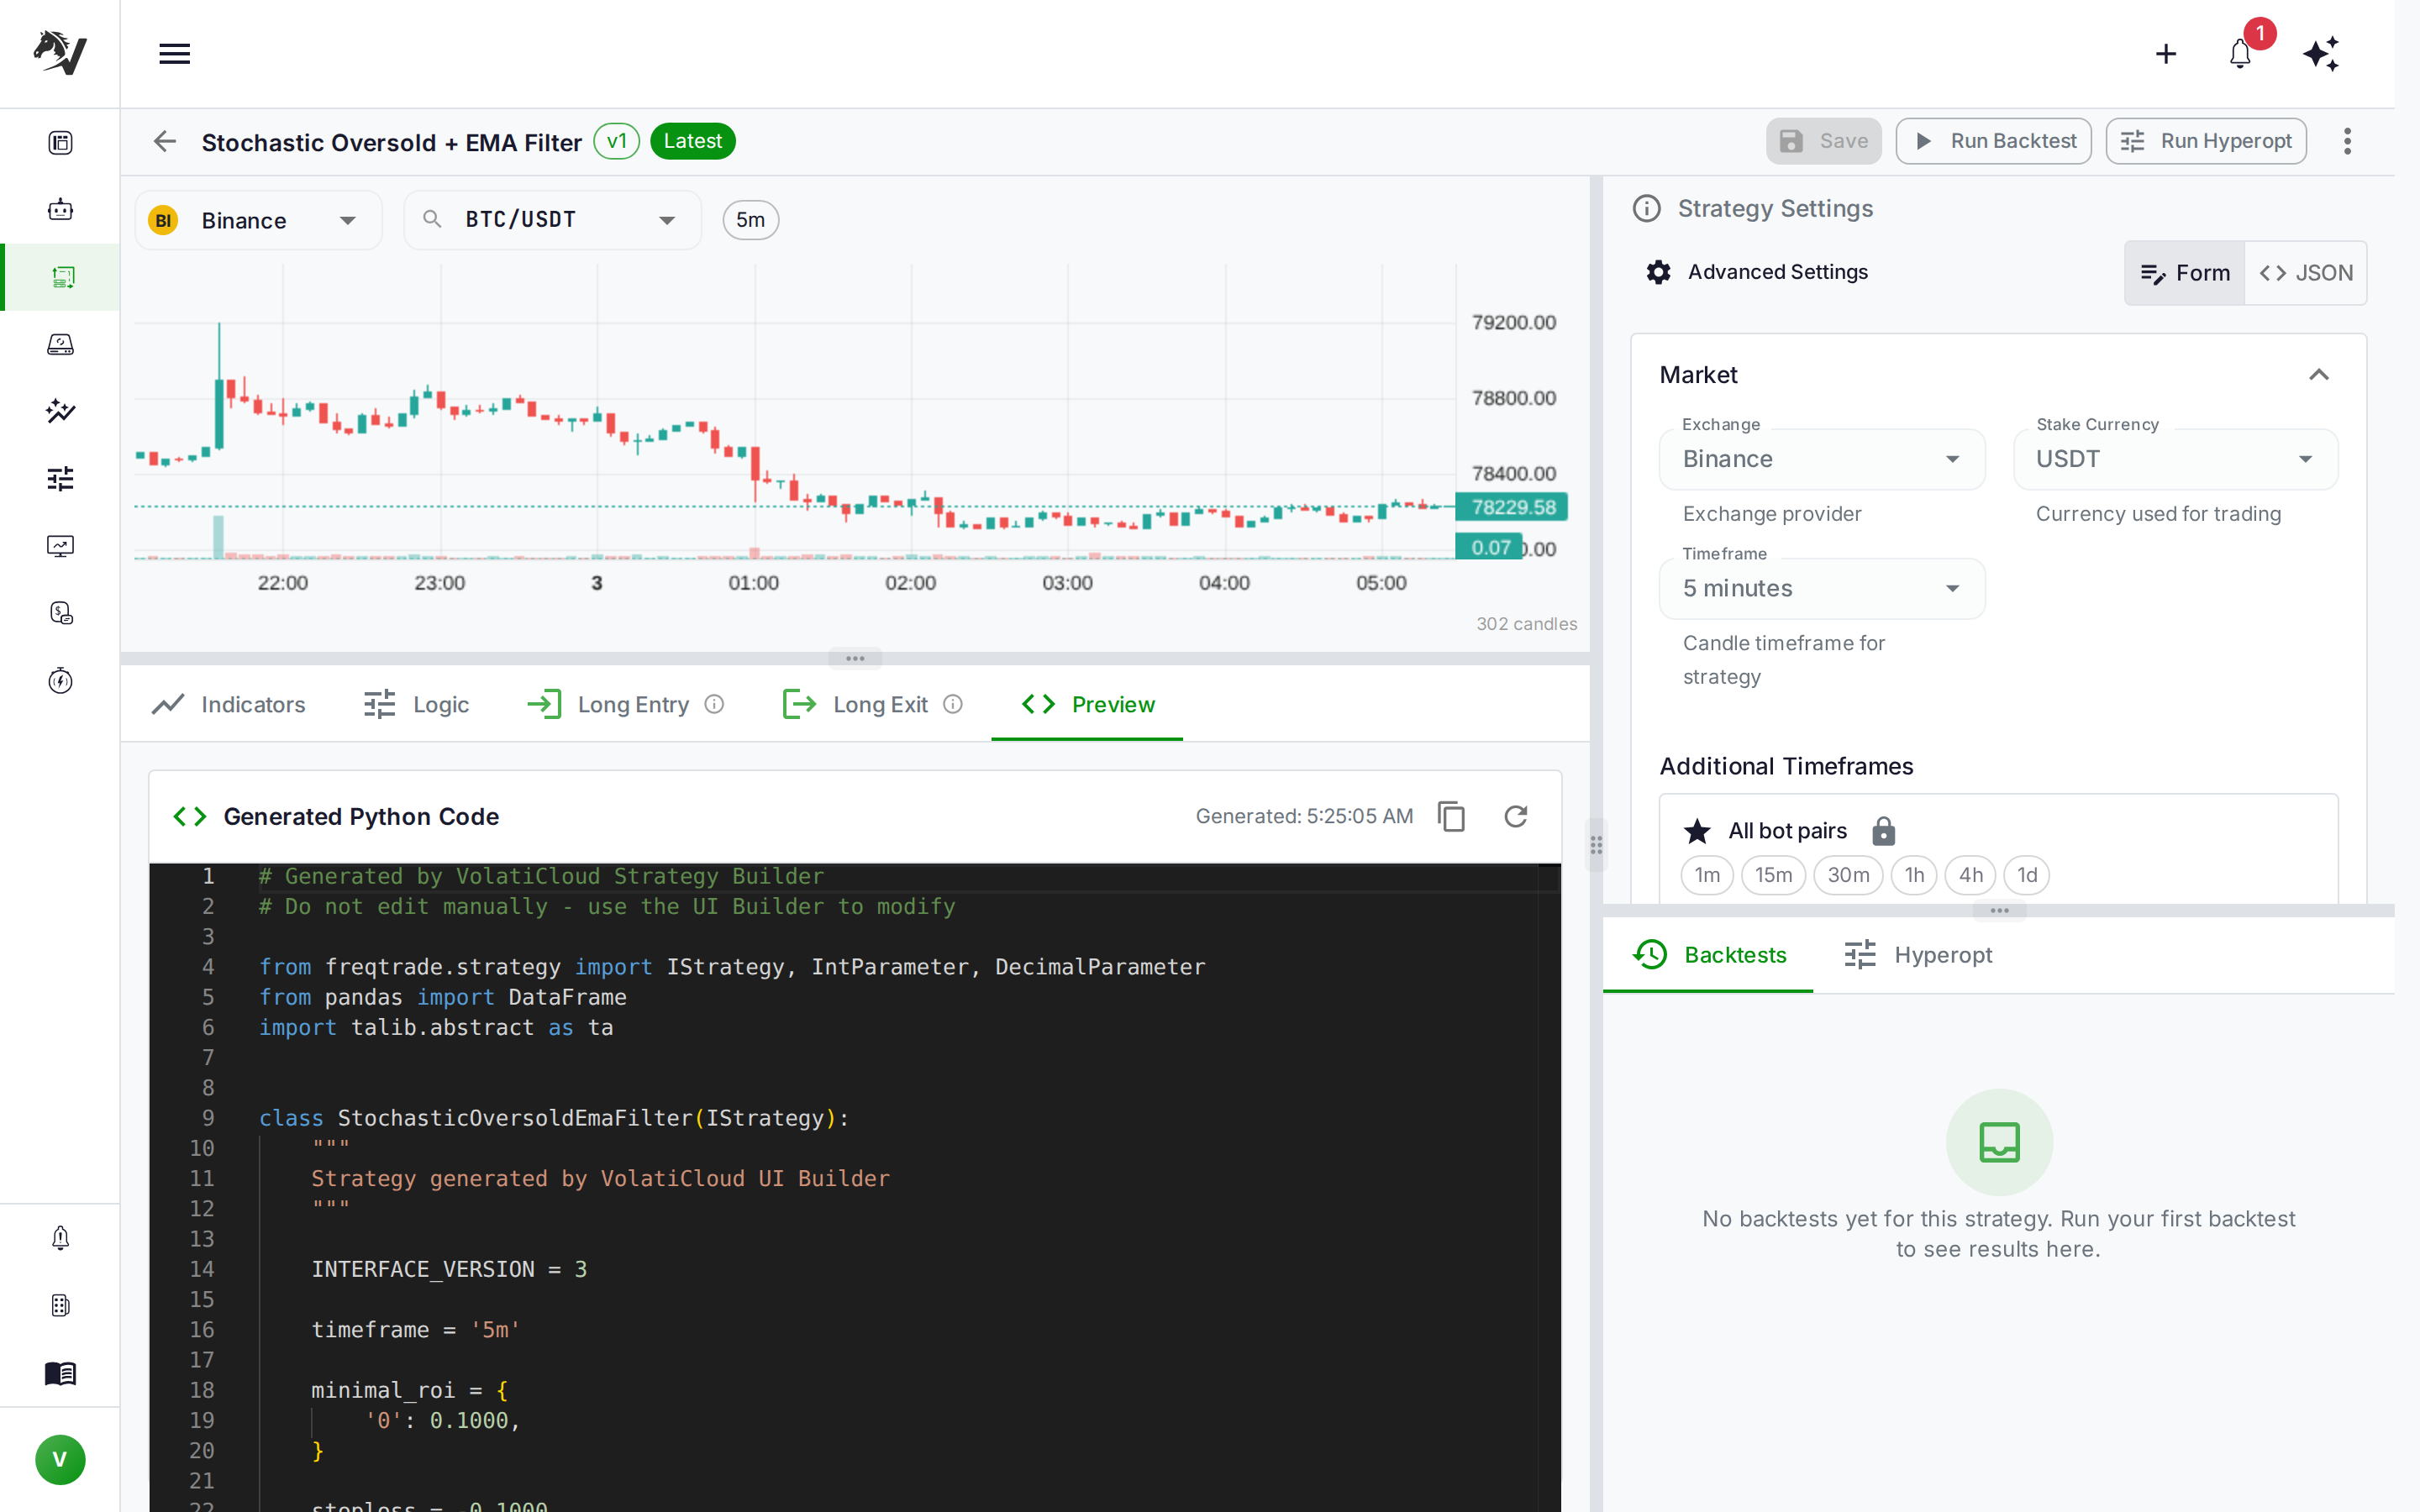
Scan the generated code against your mental model:
populate_entry_trendshould reflect your AND tree: three conditions combined with&populate_exit_trendshould show your OR conditions combined with|stoploss = -0.05for the 5% stoptimeframe = "1h"
If the code matches what you designed, the strategy is ready to test. If something looks wrong — an operator flipped, an indicator period different from what you intended — go back to the relevant tab, correct it, and re-check the preview.
You can also click Eject to Code to continue developing the strategy in Python directly. Ejection is one-way for the current version, so fork the strategy first if you want to preserve the visual version.
From Visual Strategy to Backtest
With the strategy configured and the preview validated, the natural next step is a backtest.
Click Run Backtest from the toolbar. The backtest drawer opens pre-filled with your strategy name. You'll choose:
- Date range — how far back to test (start with 1–2 years of data for a 1h strategy)
- Trading pairs — which markets to test across
- Runner — which bot runner executes the backtest
A detailed backtest guide is at Crypto Backtesting: Validate Your Strategy Before Going Live. The short version: look at profit factor, max drawdown, and Sharpe ratio before looking at total return. Total return is easy to inflate by adding leverage; the risk-adjusted metrics are harder to fake.
A strategy that passes backtesting is a hypothesis, not a guarantee. Check the walk-forward optimization guide to understand how to test on genuinely out-of-sample data before going live.
Condition Node Reference
A quick reference for the six node types and when to use each:
| Node | Use when | Example |
|---|---|---|
| AND | All conditions must be simultaneously true | Trend + signal + confirmation |
| OR | Any one condition is enough to trigger | Exit on RSI high OR bearish cross |
| COMPARE | A value is above/below/equal to another across candles | EMA(50) > EMA(200) while it holds |
| CROSSOVER | Exact moment a value crosses above another | MACD line crosses signal — once |
| IN_RANGE | A value must fall within a specific band | RSI between 45 and 65 |
| NOT | Invert a condition | NOT overbought (NOT RSI > 70) |
The most common mistake is using COMPARE where CROSSOVER is appropriate, which causes entries to fire on every candle after a cross rather than only on the crossover candle itself. Pay attention to whether you want a "state" (COMPARE) or an "event" (CROSSOVER).
Build Your Strategy
The Strategy Builder is available on every VolatiCloud plan, including the Free plan. Open the console and create your first strategy — the visual editor, 25+ indicators, and code preview are all there from day one.
For deeper reading on the visual editor's full feature set, see the UI Builder documentation and the Strategies Overview covering position modes, timeframes, and the relationship between strategy versions.
When you're ready to move beyond the visual editor, Code Mode gives you a full Python environment with the Freqtrade API and VolatiCloud's strategy analysis pipeline providing real-time feedback as you write.