Freqtrade Hyperopt: Optimize Strategy Parameters Without Overfit

Every algorithmic trading strategy has knobs. RSI period: 14? 21? 9? Entry threshold: 30, 25, 35? Stoploss: −5%, −7%, −10%? ROI target: 2%, 3%, 5%? Each combination produces a different equity curve, and the difference between defaults and optimized parameters can be the difference between a profitable strategy and a flat one. Manual trial and error doesn't scale: with five parameters and ten values each, you're looking at 100,000 combinations. Freqtrade's hyperopt — wrapped in VolatiCloud's UI — searches the parameter space intelligently with Bayesian optimization and converges on the high-performing region in hundreds of epochs, not hundreds of thousands.
The Strategy Parameter Problem
Build a momentum strategy using RSI. What period do you use? 14 is the traditional default, but is it actually optimal for your specific pairs, timeframe, and market regime? What about your entry threshold — 30? 25? 35?
Now multiply that by every configurable value in the strategy: indicator periods, condition thresholds, stoploss percentages, ROI ladders, trailing-stop offsets. The combinations explode quickly, and testing them by hand is:
- Time-consuming — running a backtest per combination takes hours to days
- Biased — humans gravitate toward "reasonable" defaults and miss counter-intuitive optima
- Incomplete — manual exploration cannot cover the full parameter space
Hyperparameter optimization (hyperopt) solves all three.
How Freqtrade Hyperopt Works on VolatiCloud
Hyperopt uses Bayesian search to systematically explore your parameter space:
- You define the search bounds. Per-parameter ranges — e.g., RSI period 5–50, entry threshold 10–40.
- The optimizer samples combinations. Bayesian acquisition functions concentrate sampling on regions of the parameter space that look promising based on prior epoch results.
- Each combination runs a full backtest. Measured against your chosen objective (Sharpe ratio, profit, drawdown, etc.).
- The optimizer converges toward the parameter set that best optimizes your objective function.
- You get data-driven parameters — not a guess, not a default.
VolatiCloud runs this on your selected Bot Runner using the same Freqtrade engine that powers standard backtests. The process is fully managed — no Python install, no infrastructure setup, no log-tailing.
Setting Up Parameters for Optimization
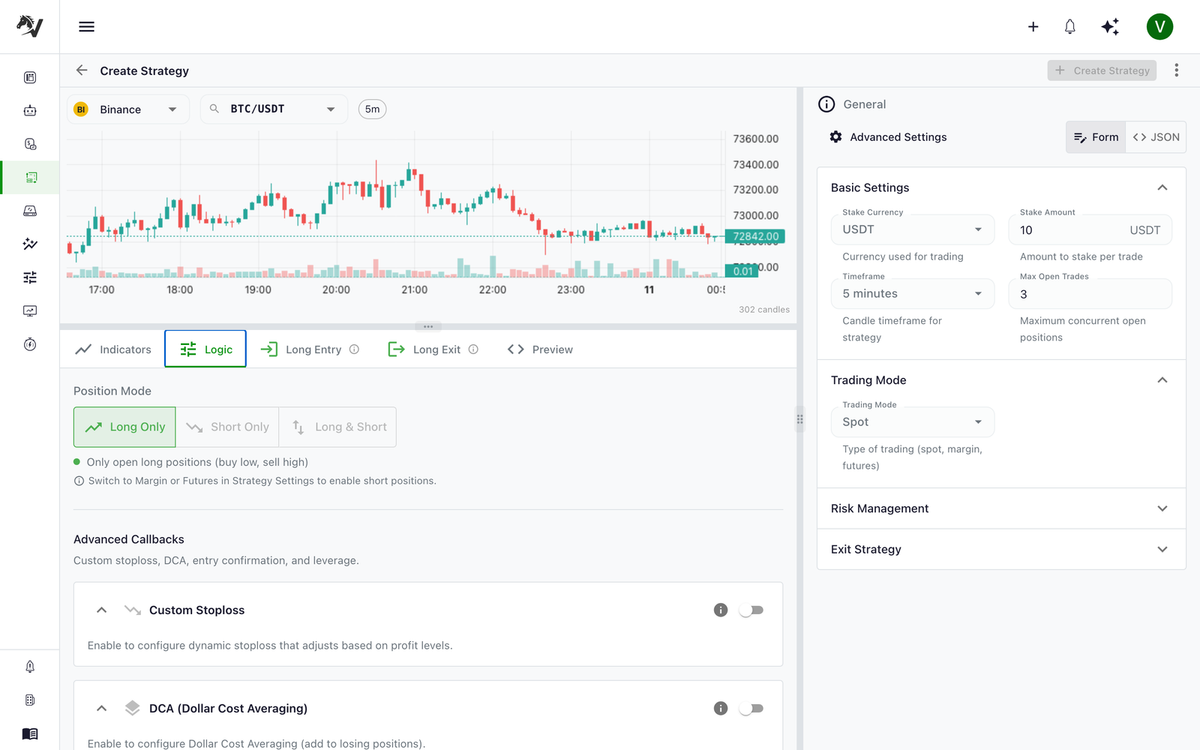
In the Strategy Studio, every numeric parameter — indicator periods, condition thresholds, constants — has an Optimize toggle. When enabled:
- Set a min and max range for the parameter
- Assign it to an optimization space (Buy Signal, Sell Signal, ROI, Stoploss, Trailing)
The optimizer searches within those bounds across all parameters you've toggled on. The full guide is in the hyperopt docs.
Keep ranges focused. RSI period 5–50 is a sensible search space. RSI period 1–500 wastes computation exploring values that make no trading sense. Start narrow, expand if the optimizer consistently lands at the edge of your range.
Choosing Your Loss Function
The loss function defines what "best" means for the optimizer. VolatiCloud exposes six options:
| Loss Function | Optimizes For | Recommended When |
|---|---|---|
| Sharpe Ratio | Risk-adjusted returns | Default — balanced risk vs reward |
| Sortino Ratio | Downside-only risk adjustment | Avoiding losses matters more than capturing all upside |
| Calmar Ratio | Return relative to max drawdown | Drawdown control is the top priority |
| Max Drawdown | Minimizing worst peak-to-trough decline | Strict capital preservation |
| Profit/Drawdown | Profit with drawdown guardrails | Want returns but not at any drawdown cost |
| Only Profit | Maximum total profit | Pure return maximization (highest overfitting risk) |
Start with Sharpe Ratio. It balances returns against volatility, which generally produces more robust strategies than pure profit optimization. After Sharpe-optimized parameters look good, run a comparison against another loss function to see whether a different objective produces meaningfully different results.
Only Profit is the loss function most prone to overfitting. It finds parameters that exploit specific historical patterns rather than generalizable trading signals. Always validate Only Profit results with an out-of-sample backtest — and ideally a Monte Carlo simulation — before trusting them.
Optimization Spaces
Rather than optimizing every parameter at once, hyperopt lets you target specific groups:
| Space | What It Searches |
|---|---|
| Buy Signal | Entry condition thresholds and indicator parameters |
| Sell Signal | Exit condition thresholds and indicator parameters |
| ROI | Time-based profit targets (the minimal_roi table) |
| Stoploss | Stoploss percentage |
| Trailing | Trailing stoploss parameters (offset, positive, etc.) |
Each additional space multiplies the search space combinatorially. Recommended workflow: start with Buy Signal and Sell Signal together, run optimization, then use the best signal parameters as a fixed baseline while separately optimizing ROI and Stoploss. This staged approach is faster and reduces overfitting risk by cutting the degrees of freedom the optimizer can use to fit historical noise.
Reading Hyperopt Results
Overview Panel
When the run completes, the overview shows:
- Best Epoch — which iteration found the optimal parameter set
- Best Loss — the objective value achieved (lower is better for most loss functions)
- Best Parameters — the exact values to apply
- Total Trades — number of trades with the optimized parameters
- Profit & Max Drawdown — performance summary for the best epoch
Epoch Table
Every completed iteration is listed with its loss value, trade count, win rate, profit, drawdown, and Sharpe. Sort by any column to explore near-optimal results — sometimes an epoch with a slightly worse loss produces a more practical parameter set (e.g., more trades for statistical significance, or rounder numbers that survive minor parameter drift).
Applying Parameters
Once you've identified the winning set, click Apply to Strategy directly from the results page. This updates your strategy's parameter values without modifying the strategy logic — the next backtest or bot deployment uses the optimized values.
How Many Hyperopt Epochs Should You Run?
| Epochs | Use Case |
|---|---|
| 50–100 | Verify setup, initial exploration, sanity-check ranges |
| 200–500 | Solid optimization for most strategies |
| 500–1,000 | Thorough search, recommended before promoting to live |
| 1,000+ | Complex strategies with large parameter spaces |
More epochs give the optimizer more chances to find the global optimum, but diminishing returns kick in once the search has converged. For most strategies, 500 epochs covers the parameter space adequately. If the loss curve is still trending down at epoch 500, run another 500 — if it's flat, stop.
Real-Time Hyperopt Monitoring
While a hyperopt runs (which can take 30+ minutes for 1,000 epochs over multi-pair multi-year data), you don't sit in the dark:
- Progress bar — updates roughly every 30 seconds with completion percentage
- Live epoch table — populates as each epoch completes; you can see results building in real time
- Container logs — stream raw Freqtrade output directly in the UI for debugging
You can navigate away and come back — the hyperopt continues on the runner.
Avoiding Overfitting in Hyperparameter Optimization
Overfitting is the central risk of hyperopt. An overfit strategy looks excellent on historical data and disappoints in live trading. Five practical safeguards:
Use out-of-sample validation. Split your historical data: optimize on years 1–2, then run a standard backtest (no further tuning) on year 3. If performance drops materially out-of-sample, the parameters are overfit. The avoiding overfitting post covers the methodology in detail.
Fewer optimizable parameters is better. Every parameter you optimize is a degree of freedom the optimizer can use to fit noise. Only toggle optimization on parameters that meaningfully affect strategy behavior. Three parameters with focused ranges beat ten parameters with wide ranges.
Sanity-check extreme values. If the optimal RSI period is 47 and threshold is 31.7, ask whether those values make practical trading sense. Conventional ranges (RSI period 10–20, threshold 25–35) are often more robust than precisely optimized edge values that happen to fit the training set.
Run Monte Carlo afterward. Apply the optimized parameters, run a backtest, then put those results through Monte Carlo simulation. Wide p5/p95 confidence bands or non-trivial risk-of-ruin numbers indicate the parameters are fragile.
Compare loss functions. If Sharpe optimization and Only Profit optimization produce wildly different parameter sets, the strategy is fragile. Robust strategies tend to produce similar parameters across different objectives.
For an even stricter validation, see walk-forward optimization — which explicitly reserves rolling out-of-sample windows.
A Practical Hyperopt Workflow
The workflow that produces parameters you can actually trust:
- Build your strategy with sensible defaults from indicator literature
- Run an initial backtest over 2+ years to establish a baseline
- Enable optimization on 3–5 key parameters with focused ranges
- Run hyperopt with 500 epochs, Sharpe loss function, on Buy/Sell Signal spaces
- Validate out-of-sample — standard backtest on a date range not used in optimization
- Run Monte Carlo simulation on the validated backtest
- Apply parameters to your strategy if results hold up across both gates
- Paper trade before committing real capital — see paper trading to live
This turns parameter selection from a guessing game into a systematic, data-driven decision.
Plan Details
Hyperparameter optimization is available on Pro and Enterprise plans:
| Pro | Enterprise | |
|---|---|---|
| Max concurrent hyperopts | 2 | 5 |
| Max epochs per run | 1,000 | 10,000 |
Starter plan users can upgrade to Pro. The 7-day Pro trial comes with $60 of credits, so you can try hyperopt before committing to a plan: a card is collected at checkout, nothing is charged before day 7, and the trial converts to paid Pro on day 7 unless you cancel first. It is available once per user and once per organization, to an organization that has never held a subscription.
Getting Started With Hyperopt
- Open a strategy in the Strategy Studio
- Enable the Optimize toggle on the parameters you want to tune
- Set min/max ranges for each
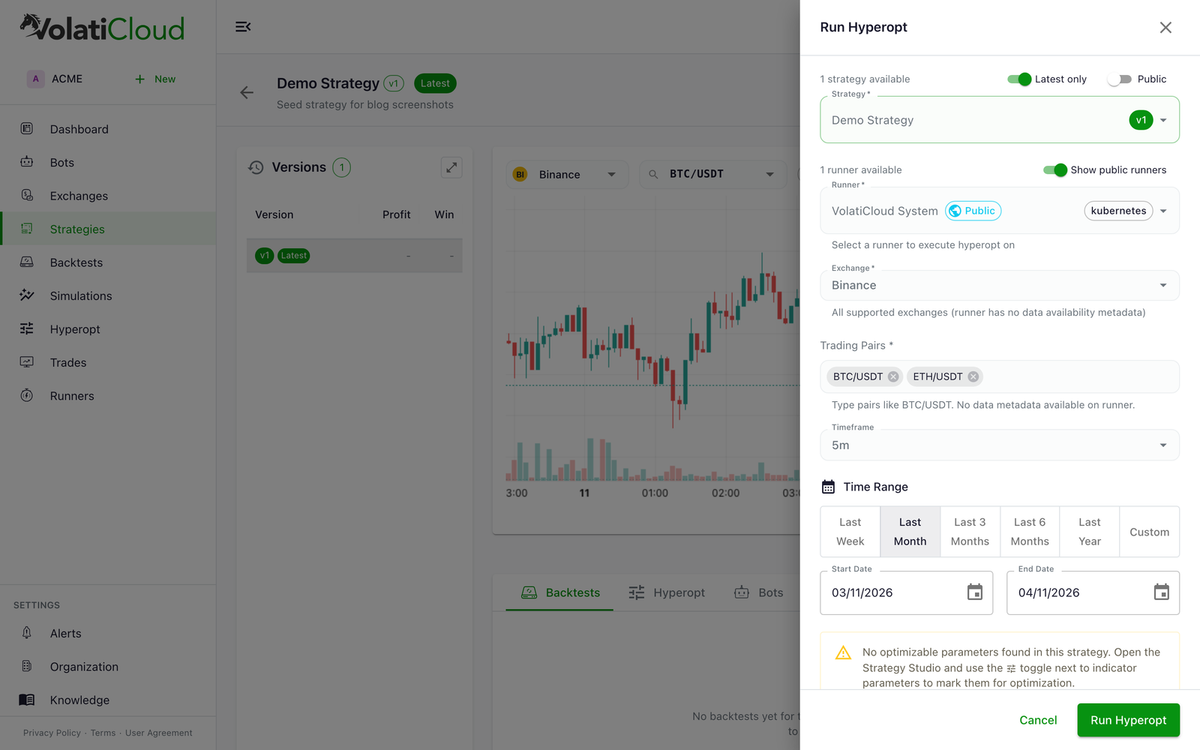
- Navigate to Hyperopt in the sidebar
- Select your strategy, runner, and search settings
- Click Run Hyperopt and watch the epoch table populate
To run your first hyperopt, open a strategy in the VolatiCloud console, enable the Optimize toggle on a few key parameters, set their min/max ranges, and launch a 500-epoch run with Sharpe Ratio. Validate the result on a holdout date range before applying it to a live bot.