ATR Stop-Loss Strategy: Dynamic Risk Management for Crypto Bots

A stop-loss set at 5% below entry behaves very differently on a stable large-cap than on an asset that regularly swings 8% in a single session. Fixed percentage stops treat all assets identically — which means they're either too tight for volatile pairs (triggering unnecessary exits during normal fluctuation) or too wide for calm pairs (accepting larger losses than needed). Average True Range offers a better approach: a volatility-adjusted stop that automatically widens when markets are choppy and tightens when price action quiets down.
What ATR Measures
Average True Range is a volatility indicator, not a directional one. It does not predict whether price will rise or fall — it measures how much price has been moving over a given lookback period.
ATR is computed in two steps.
Step 1 — True Range per candle:
The True Range (TR) is the largest of three values:
- High − Low (the candle's full body-and-wick range)
- |High − Previous Close| (captures gap-ups)
- |Low − Previous Close| (captures gap-downs)
Taking the maximum of all three ensures that any significant price jump between sessions is captured, not just the intraday range.
Step 2 — Smooth over N periods:
ATR is Wilder's smoothed average of True Range over the last N candles (default: 14):
ATR(n) = ((n−1) × ATR(n−1) + TR(n)) / n
A 14-period ATR on a 4-hour chart reads: "this asset has moved roughly X per 4-hour candle on average over the past 56 hours." On a daily chart with ATR = $1,200, Bitcoin has been moving about $1,200 per day on average. A stop placed at 2× ATR below entry would sit $2,400 away — far enough that normal daily noise doesn't trigger it.
Why Fixed Percentage Stops Underperform in Crypto
The problem with a fixed 3% stop-loss is that it ignores the current market environment entirely.
| Scenario | Asset | Typical daily range | Fixed 3% stop | Likely outcome |
|---|---|---|---|---|
| Low volatility | BTC (consolidating) | 1.5–2% | Wider than typical move | Generally fine |
| High volatility | SOL (breakout phase) | 5–8% | Tighter than typical move | Constant premature exits |
| Low volatility | DOGE | 3–4% | About equal to typical move | Borderline; many false exits |
In the high-volatility row, a 3% stop gets triggered during normal price fluctuation — not because the trade thesis was wrong, but because the asset's baseline movement exceeds the stop width. The bot exits and misses the eventual move.
The inverse failure is quieter but equally damaging: during low-volatility compression, a 3% stop may be wider than necessary, meaning a losing trade runs further than it needs to before getting cut.
ATR-based stops solve both problems by scaling the stop distance to observed market conditions.
The ATR Multiplier Method
The core formula for ATR stop placement is:
Long stop-loss  = Entry price − (multiplier × ATR)
Short stop-loss = Entry price + (multiplier × ATR)
Choosing the multiplier:
| Multiplier | Behavior | Suited for |
|---|---|---|
| 1× ATR | Tight stop, exits on moderate noise | Scalping, very short timeframes |
| 1.5× ATR | Moderate filter, some noise tolerance | Intraday strategies on 15m–1h |
| 2× ATR | Standard choice — filters most normal fluctuation | Swing trading on 4h–daily |
| 3× ATR | Wide, very low exit frequency | Trend-following on slower timeframes |
The 2× multiplier is the most common starting point. With normally distributed returns, two standard deviations capture roughly 95% of typical movement — the same statistical rationale behind 2× Bollinger Band multipliers. A stop placed at 2× ATR should avoid getting knocked out by regular noise in most market conditions.
Going to 3× reduces false exits further, but means accepting a meaningfully larger loss on each failed trade. Going to 1× increases sensitivity and trade frequency at the cost of more whipsaws.
The right multiplier is not universal — it depends on timeframe, asset, and how your entry logic behaves. Always backtest before settling on a value.
ATR-Based Position Sizing
Stop width and position size are two sides of the same risk equation. Once you know the ATR-based stop distance in dollar terms, you can work backwards to derive the correct position size for a given account risk target.
Position size = (Account risk per trade $) / (ATR × multiplier)
Example: $20,000 account, 1% risk per trade ($200), ETH at $3,000, ATR = $90, multiplier = 2×:
Stop distance = 2 × $90 = $180
Position size = $200 / $180 ≈ 1.11 ETH
This approach — sometimes called volatility-adjusted position sizing — produces a self-calibrating system:
- During high-volatility periods, ATR is large → stop is wide → position size shrinks to maintain the same dollar risk
- During low-volatility periods, ATR is small → stop is tight → position size grows to use the same risk budget
The practical effect is a smoother equity curve. Large single-trade losses become structurally harder because the position size automatically decreases when the market is most dangerous. This is the same principle discussed in the risk management and position sizing guide, applied specifically to ATR-derived stop distances.
Building ATR Conditions in VolatiCloud
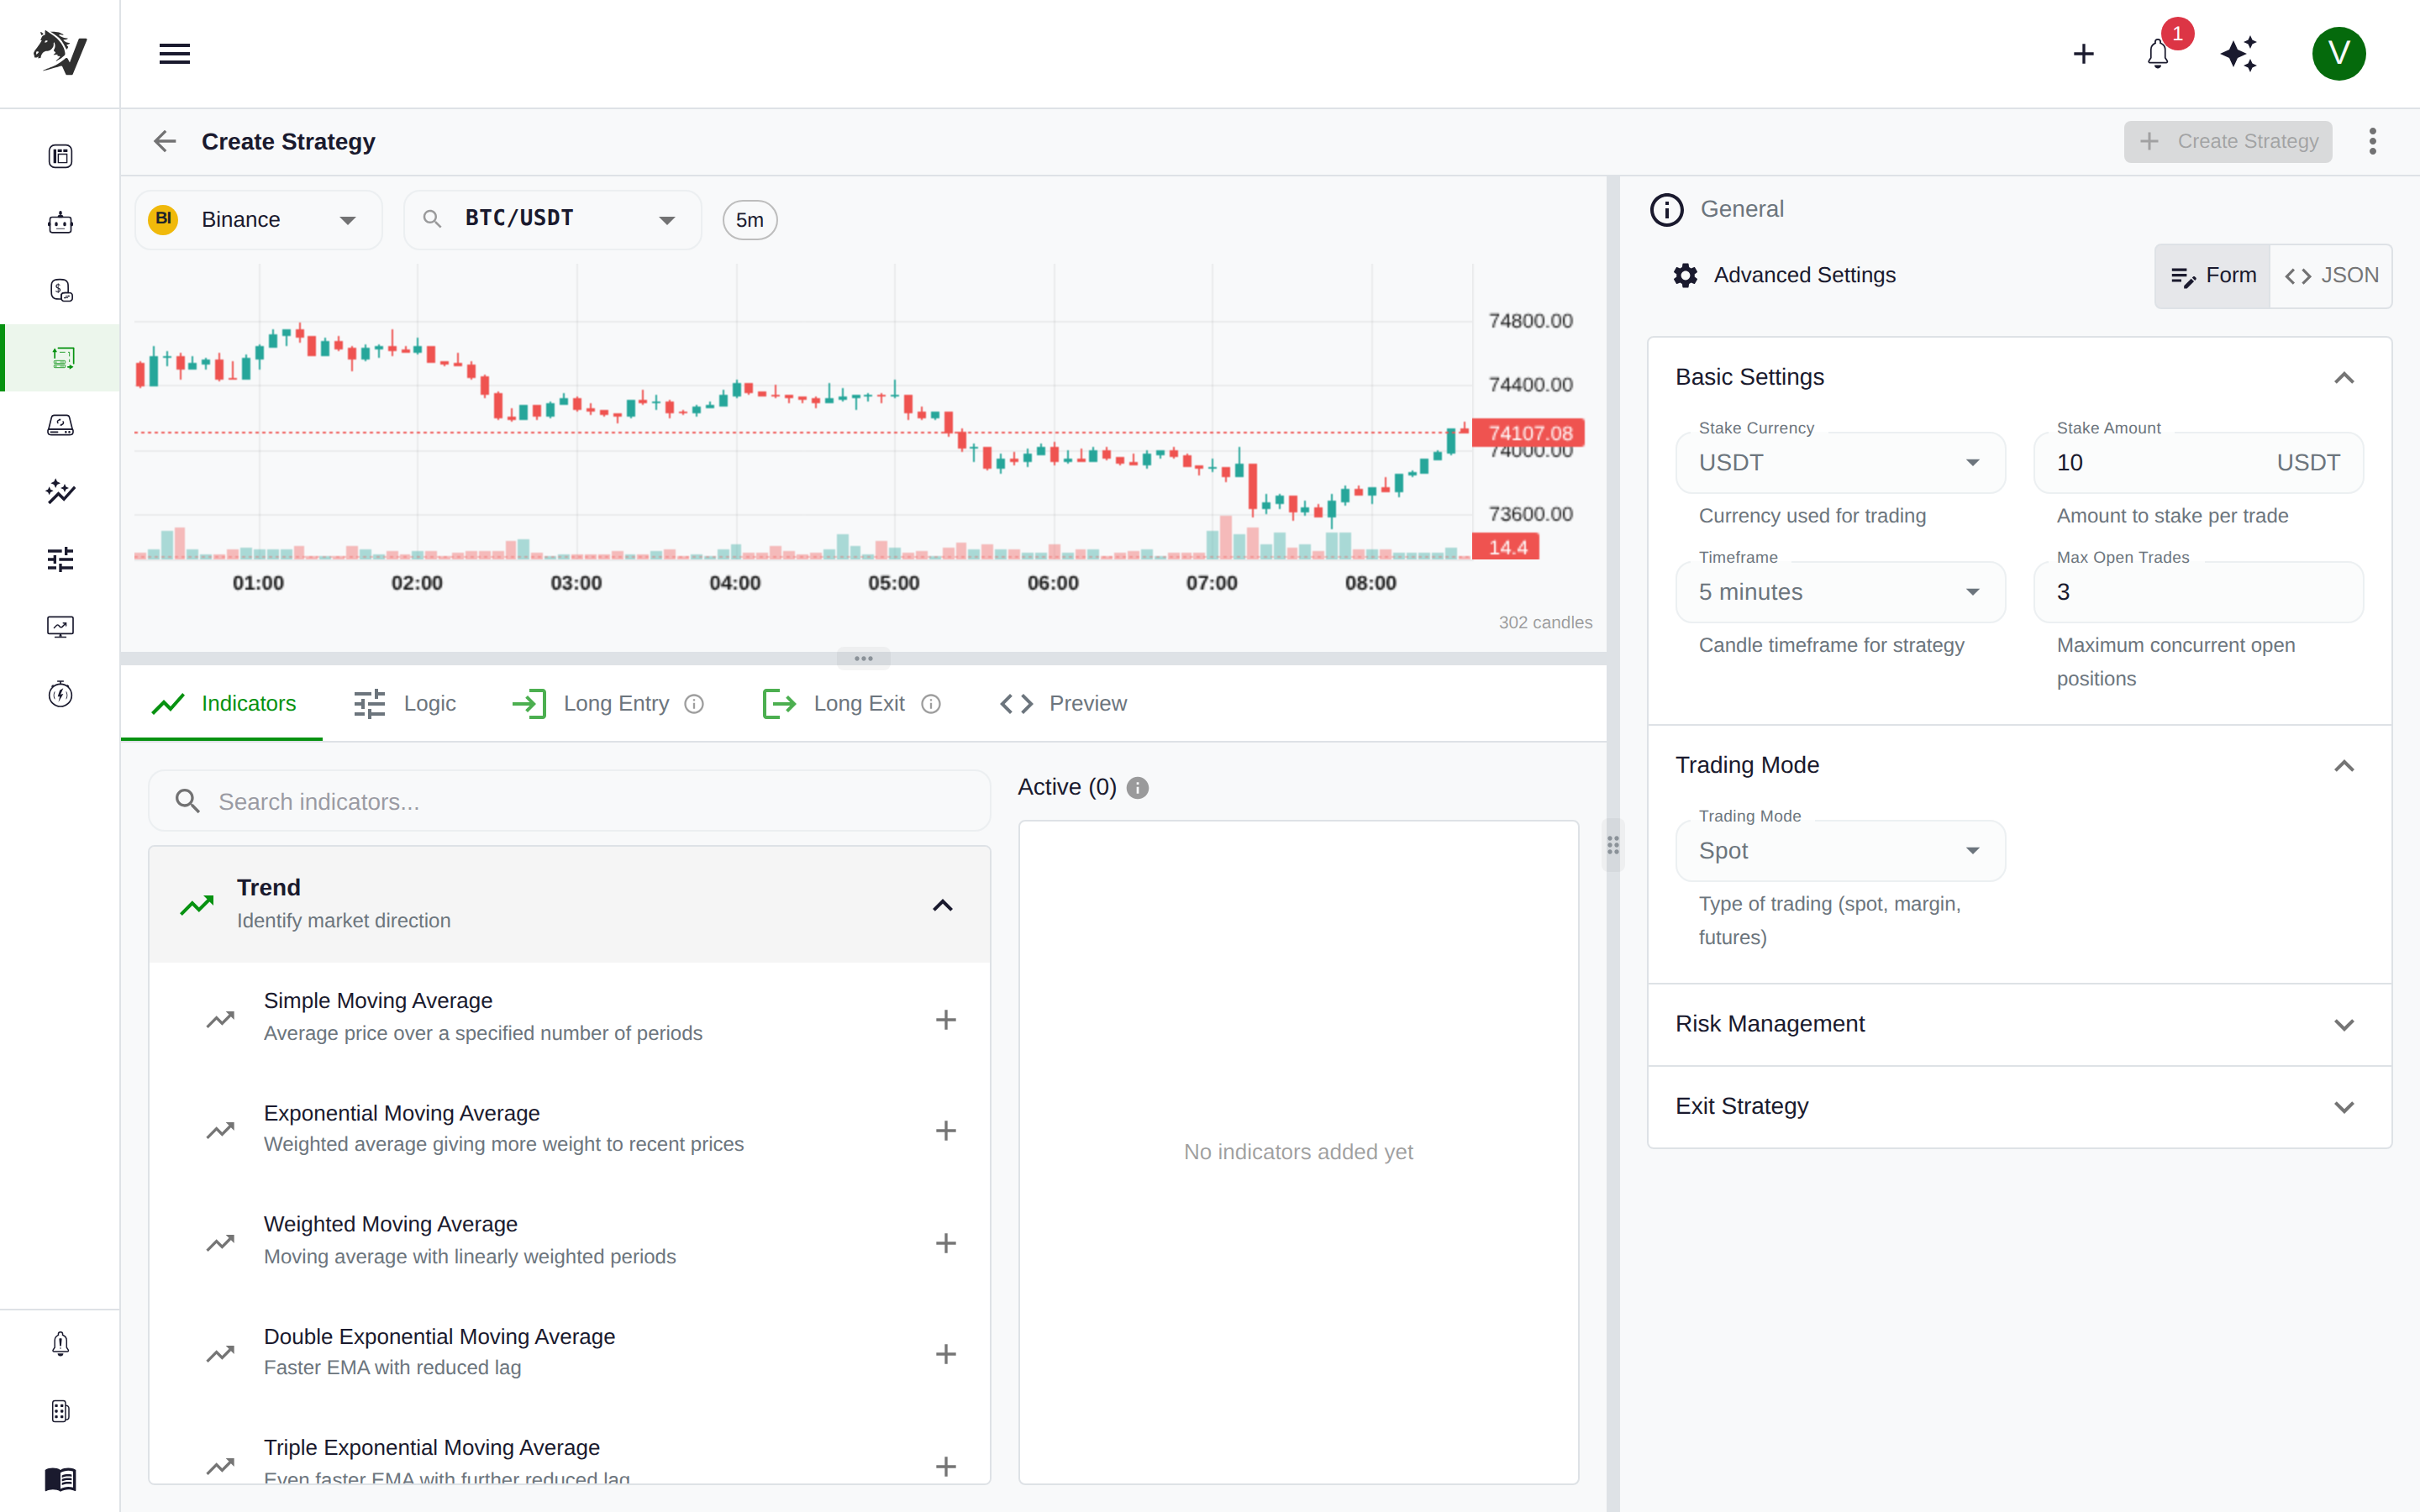
VolatiCloud's Strategy Builder supports ATR natively as a configurable indicator operand. You can use ATR in entry condition logic — for example, as a volatility filter that prevents entries when the market is too quiet or too wild.
ATR volatility filter — step by step:
Open the VolatiCloud console, create a new strategy, and select UI Builder mode. Add a COMPARE node:
- Left operand: ATR (period 14)
- Operator:
gt(greater than) - Right operand: CONSTANT
Set the constant to a threshold based on your pair's typical ATR. For example, on BTC/USDT at 4-hour intervals, you might set this to $500 — meaning the strategy only enters when BTC is moving at least $500 per 4-hour candle. Below that threshold, the spread and fee drag are too high relative to the expected move.
To add this as a required condition alongside your primary entry signal, connect it to an AND node with your other conditions. The strategy only triggers when all connected conditions are met simultaneously.
For strategies using moving average crossovers or RSI entries, an ATR filter is an effective complement: the EMA/RSI logic identifies signal direction; the ATR filter confirms that the market is active enough to make the trade worthwhile. See the EMA crossover strategy guide for the directional logic side of that combination.
Configuring ATR-calibrated stop-losses in bot settings:
The stop-loss percentage in a bot's configuration is set at strategy-design time based on your ATR analysis for the target pair and timeframe. Once you've determined that 2× ATR represents approximately 4% of price for your setup, configure:
{
  "stoploss": -0.04,
  "trailing_stop": true,
  "trailing_stop_positive": 0.02,
  "trailing_stop_positive_offset": 0.03
}
This sets an initial 4% stop (ATR-calibrated) and activates a trailing stop once the trade moves 3% in your favor, trailing at 2%. The trailing mechanism locks in profit as the trade extends, while the ATR-calibrated initial stop keeps the bot from exiting on normal volatility.
See the bot creation guide for the full list of configurable risk parameters.
Backtesting ATR Stop-Loss Strategies
ATR-based stops produce a distinctive backtest profile compared to fixed-stop systems:
Expected characteristics:
- Fewer premature exits: The stop scales with volatility, so normal fluctuation doesn't trigger it as often
- Variable loss sizes: Losing trades vary in dollar terms across periods (since ATR changes), though they're bounded by your position sizing formula
- Better trend-following performance: Wide ATR stops in trending markets allow the bot to stay in profitable trades longer
Metrics to focus on:
Maximum drawdown vs. win rate. ATR stops often improve win rate by reducing false exits, but each individual loss may be larger (since the wider stop means the price traveled further before triggering). Evaluate drawdown and average loss together.
Performance across distinct market regimes. Run separate backtests on a trending period and a sideways-ranging period. ATR-based stops can behave very differently in each environment.
Average hold time. Wider stops mean trades run longer before being exited by noise. Your backtest will likely show longer average trade duration than a fixed-stop equivalent — this is expected and generally positive.
See running backtests for setup, and analyzing backtest results for a breakdown of each metric.
After completing your primary backtest, run Monte Carlo simulation on the trade history to verify that the edge holds across randomized trade orderings — not just the specific sequence that occurred historically. The Monte Carlo simulation guide explains what to look for in the simulation output.
When testing ATR strategies, avoid using the same date range for optimization and final evaluation. A 2× ATR multiplier that performs best on your training data may not be optimal out-of-sample. Reserve 20–30% of your date range as a holdout period for final evaluation only.
Optimizing ATR Parameters
There are two primary parameters to tune:
- ATR period (default 14): Shorter periods react faster to recent volatility changes; longer periods smooth over a broader history and change more slowly
- ATR multiplier: Controls the stop width relative to current volatility
A practical search space for VolatiCloud's hyperparameter optimization:
{
  "atr_period": {
    "type": "int",
    "low": 7,
    "high": 28,
    "step": 1
  },
  "atr_multiplier": {
    "type": "float",
    "low": 1.0,
    "high": 3.0,
    "step": 0.25
  }
}
Always validate the optimized combination on a holdout date range that the optimizer never saw. The hyperparameter optimization guide explains how to configure spaces, run epochs, and evaluate results against an out-of-sample period.
The avoiding overfitting guide is also worth reading before optimization: ATR parameters are relatively robust across market conditions, but over-optimizing the multiplier to a specific historical period is still possible.
Do not optimize ATR period and stop-loss percentage as independent parameters on the same strategy. They interact — a 14-period ATR at 4% stop may be functionally identical to a 7-period ATR at 2% stop on the same pair. Optimize the combined system behavior (via the multiplier directly), not the parameters in isolation.
ATR Compared to Other Volatility Tools
ATR is one of several volatility-aware tools available in VolatiCloud. Here's how they compare:
| Tool | What it measures | Best use |
|---|---|---|
| ATR | Absolute price movement per period | Stop placement, position sizing |
| Bollinger Bands | Standard deviations from rolling mean | Mean reversion entries, squeeze detection |
| ATR (trailing) | Dynamic distance from highest high/low | Trailing stop management mid-trade |
| Stochastic | Price position within recent high-low range | Overbought/oversold in ranging markets |
ATR and Bollinger Bands are frequently combined: Bollinger Bands signal when to enter (price at a band extreme), ATR determines how tight to set the stop after entering. The result is a strategy where entry timing comes from one indicator and risk management from another. The Bollinger Bands strategy guide covers the entry logic side of that pairing.
For purely directional entry signals (trend-following), ATR stops pair naturally with EMA crossover or MACD-based entries — the directional indicator identifies momentum, ATR keeps the stop from getting whipsawed out before the trend develops. The MACD strategy guide is a useful companion for configuring the entry side of such a system.
Get Started with ATR-Based Stops
ATR-calibrated stops are one of the most practical improvements you can make to an existing algorithmic strategy. They adapt to the market environment automatically, without requiring manual adjustment as volatility regimes shift.
To implement ATR-based risk management in VolatiCloud:
- Open the VolatiCloud console and navigate to your strategy
- Add ATR entry conditions using the Strategy Builder — for example, a volatility filter that only allows entries when ATR exceeds a minimum threshold
- Calculate the appropriate stop-loss percentage for your target pair using 2× ATR at current market conditions
- Run backtests covering multiple volatility regimes using the backtesting guide
- Optimize ATR period and multiplier with hyperparameter optimization, validating on a holdout period
- Paper trade the calibrated setup before going live — the paper trading guide walks through the full process
When stop distances adapt to the market rather than ignoring it, the gap between backtest performance and live performance tends to narrow. Strategies that fail in live trading often do so because their fixed stops were calibrated for conditions that no longer exist. ATR-based stops eliminate that assumption.