Bollinger Bands Strategy: Crypto Mean Reversion & Squeeze Trades

Bollinger Bands are unlike most technical indicators because their geometry changes. RSI has fixed thresholds at 30 and 70. Moving averages have fixed periods. Bollinger Bands adapt to market volatility — widening when prices swing wildly, tightening when markets go quiet. That adaptive behavior is their greatest strength, and the reason most traders misuse them: a band touch in a calm market means something completely different from a band touch during a volatility breakout. This guide separates the two, walks through both the mean reversion and squeeze breakout setups in VolatiCloud, and shows the parameters that actually matter when you backtest.
What Bollinger Bands Measure
Bollinger Bands consist of three lines plotted around price:
- Middle band: a simple moving average (default: 20-period SMA)
- Upper band: middle band + (standard deviation × multiplier)
- Lower band: middle band − (standard deviation × multiplier)
The default multiplier is 2.0. With normally distributed returns, bands set at ±2 standard deviations capture approximately 95% of price action — meaning price spends only about 5% of the time outside the bands. When it does venture outside, that's a statistically unusual event.
What that means, however, depends entirely on the market context. And that's where most BB-based crypto strategies go wrong.
Typical Bollinger Bands parameter values
- Period (SMA length):
20(Bollinger's original default),10for faster signals,50for swing-trade signals - Multiplier (std dev):
2.0(standard, ~95% coverage),1.5for more frequent touches,2.5for stricter setups - Source:
close(default),hlc3to reduce wick sensitivity - Best timeframes: 1h–4h for active strategies; daily for position trading
Two derived values worth knowing
- %B: shows where price sits relative to the bands.
%B = 1.0means price is at the upper band;0.0means it's at the lower band;0.5is the middle. Values above 1.0 or below 0.0 indicate price has broken outside the bands. - Bandwidth:
(Upper − Lower) / Middle × 100. Measures how wide the bands are relative to price. Low bandwidth indicates compressed volatility — the precondition for a Bollinger Squeeze.
Two Valid Strategies, Two Opposite Logics
BB strategies split into two approaches with opposite entry logic.
| Approach | Entry signal | Market condition | Logic |
|---|---|---|---|
| Mean reversion | Price touches lower band → buy | Wide bands, ranging market | Extreme move will reverse toward middle |
| Breakout | Price breaks above upper band after squeeze → buy | Narrow bands expanding | Volatility expansion underway |
These two setups operate on opposite assumptions. Mean reversion expects price to return from the band toward the center. Breakout trading expects price to continue moving away from center.
Using mean reversion logic during a breakout is one of the most common — and expensive — mistakes in algorithmic trading. A narrow band that suddenly expands can send price far above the upper band and keep going for days. Buying that as "overbought" means fighting momentum at exactly the wrong moment.
The key is detecting which regime the market is in before applying the corresponding strategy.
Bollinger Bands Mean Reversion Setup
The classic BB mean reversion trade works in ranging conditions where price oscillates between the upper and lower bands without breaking through consistently.
Entry logic:
- Close price is below the lower Bollinger Band (period 20, multiplier 2.0)
- Optional: RSI (period 14) below 35 as additional oversold confirmation
Exit logic:
- Price returns to the middle band (the 20-period SMA)
- Or a fixed stop-loss triggers if the move continues lower
The rationale: a close below the lower band means price has moved more than 2 standard deviations from its recent mean. In a ranging environment, this level of deviation is temporary. Buying the extreme and targeting a return to average is a positive-expectancy trade — as long as the market is not trending.
That last condition is the catch. In a sustained downtrend, price can walk along the lower band for days, triggering entry after entry as the trend grinds lower. Adding a trend filter — for example, only taking long signals when price is above the 200-period SMA — substantially reduces this failure mode.
This is the same trend-filter concept discussed in the EMA crossover strategy guide, applied here to mean reversion: let the long-term trend determine which direction signals you accept.
The Bollinger Squeeze: Detecting Volatility Breakouts
Financial markets alternate between contraction and expansion. Periods of narrow, quiet price action build energy for the next large move. Bollinger Bands visualize this directly: when the bands compress to their tightest reading in weeks, a breakout is typically near.
Squeeze detection:
- Calculate bandwidth over the last N bars
- When bandwidth drops to its lowest value in the previous 20 bars, the squeeze is "on"
- When bandwidth starts expanding and price breaks above the upper band → buy
- When bandwidth starts expanding and price breaks below the lower band → short
The breakout entry does the opposite of mean reversion: instead of fading price toward a band, it follows price after the band is broken. The logic is that the breakout represents the release of compressed volatility, and that momentum tends to carry price significantly further in the breakout direction.
The squeeze doesn't tell you which direction the breakout will go — only that one is coming. Always wait for confirmation from the price break above or below the corresponding band before entering.
Building Bollinger Bands Strategies in VolatiCloud
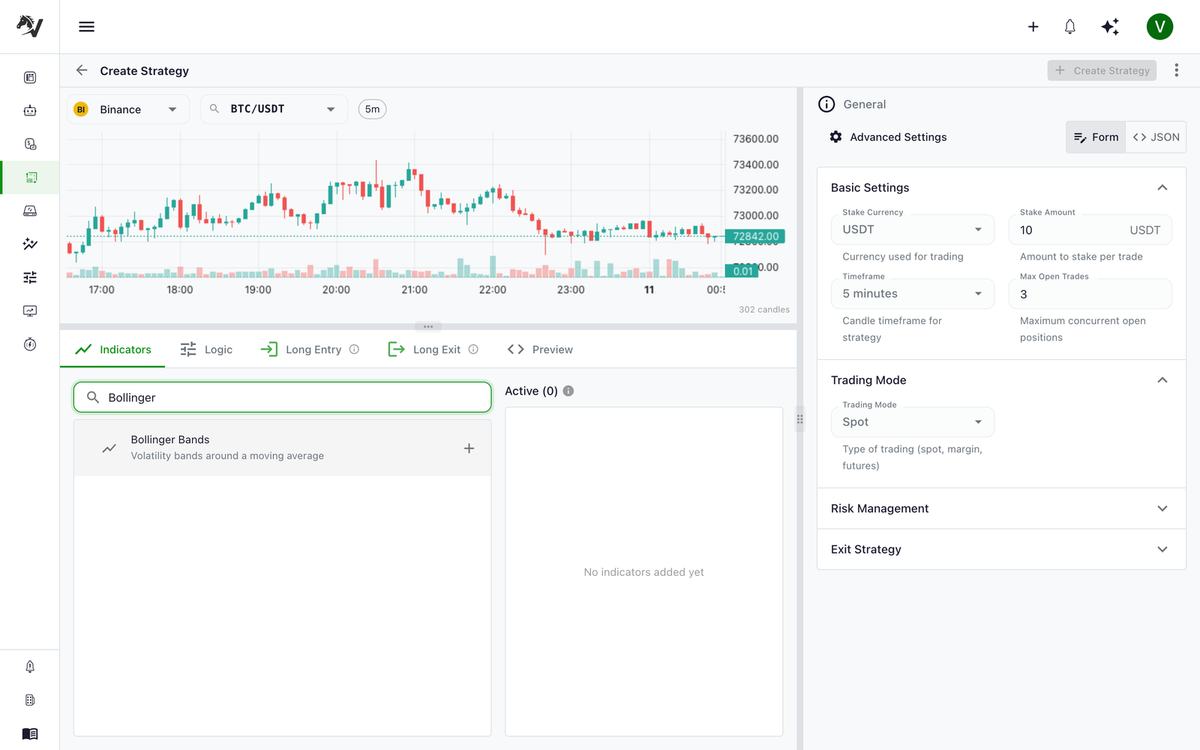
VolatiCloud's Strategy Builder supports Bollinger Band indicators natively. Both the mean reversion and breakout setups can be configured visually without writing any code.
Mean reversion setup — step by step
Open the VolatiCloud console, create a new strategy, and select UI Builder mode. Add a COMPARE node with:
- Left operand: PRICE (close)
- Operator:
lt(less than) - Right operand: Bollinger Lower Band, period 20, multiplier 2.0
This fires when the closing price drops below the lower band.
To add RSI confirmation, add a second COMPARE node:
- Left operand: RSI, period 14
- Operator:
lt - Right operand: CONSTANT, value
35
Connect both COMPARE nodes to an AND node. The strategy enters only when price is below the lower band and RSI is simultaneously below 35 — filtering out entries where price is falling but momentum is not yet oversold. The RSI mean reversion guide covers RSI behavior and parameter selection in more detail.
To add the 200-period trend filter, add one more COMPARE node:
- Left operand: SMA, period 200
- Operator:
lt - Right operand: PRICE (close)
This reads as "price is above the 200-period SMA." Connect it to the same AND node. Now all three conditions must hold before the strategy enters a long trade.
Target exit: Set the ROI target to the middle band area. In practice, a fixed ROI of +2% to +4% at a short time horizon captures the mean reversion move without waiting for an exact band return.
Parameter Selection and Optimization
The 20-period SMA and 2.0 multiplier are reasonable starting points — not optimal for every pair or timeframe.
| Timeframe | Suggested period | Multiplier | Typical use |
|---|---|---|---|
| 15m | 10–20 | 1.5–2.0 | Higher-frequency mean reversion |
| 1h | 20–30 | 2.0 | Intraday swings |
| 4h | 20–50 | 2.0–2.5 | Multi-day swings |
| Daily | 20 | 2.0 | Position-level signals |
Lowering the multiplier to 1.5 creates tighter bands that price touches more frequently, generating more entry signals at the cost of more false positives. Raising it to 2.5 generates rarer signals that represent more extreme price moves.
Period and multiplier interact: changing one changes the meaning of the other. Optimize them together, not in isolation.
VolatiCloud's hyperparameter optimization can search across both parameters simultaneously. A practical search space:
{
  "bb_period": {
    "type": "int",
    "low": 15,
    "high": 35,
    "step": 1
  },
  "bb_std_dev": {
    "type": "float",
    "low": 1.5,
    "high": 2.5,
    "step": 0.1
  }
}
Always validate any optimized combination on a holdout date range the optimizer never saw — or take a step further with walk-forward optimization, which tests parameter stability across multiple time windows.
Backtesting Bollinger Bands Strategies
BB mean reversion strategies have a characteristic backtest profile: relatively high win rates (often 60–75%), but occasional large losses during trending periods. Understanding this profile helps you evaluate backtests honestly.
Maximum consecutive losses. Mean reversion strategies that work in ranging markets will have losing streaks during trending periods. How long are those streaks? What percentage of capital do they consume?
Performance segmented by market regime. Run separate backtests for a trending period and a ranging period. A strategy that looks excellent on a combined view can mask severe underperformance during one regime. VolatiCloud's backtesting engine lets you specify exact date ranges for each test.
Profit factor. For mean reversion strategies, a profit factor above 1.3 is a reasonable target before accounting for fees. Below 1.1, real-world transaction costs and slippage will likely eliminate the edge entirely.
See analyzing backtest results for a breakdown of each metric and how to interpret them.
After backtesting, run Monte Carlo simulation on your trade history to stress-test the strategy against random orderings of the same trades. If the edge is real, it should hold across thousands of alternative trade sequences — not just the one that happened to occur in your backtest.
BB mean reversion strategies often look significantly better in backtests than they perform live. The difference is usually accounted for by look-ahead bias in indicator calculation and slippage on entry. Set conservative expectations and paper trade first.
Common Bollinger Bands Mistakes
Treating the bands as hard support/resistance. Price can — and routinely does — close below the lower band on multiple consecutive candles. A band touch is a signal, not a guarantee of reversal.
Mixing mean reversion and breakout logic on the same pair. Running a BB mean reversion bot alongside an EMA trend-following bot on the same pair creates conflicting signals. The EMA bot enters long precisely when the BB bot is hoping to close its position at the middle band. Use different pairs or coordinate deliberately.
Forgetting transaction costs when optimizing. A mean reversion strategy may generate many trades. At 0.1% per trade (maker + taker), ten trades per week produces an annual drag of roughly 10%. Always include realistic fee assumptions in your backtests.
Ignoring regime context during optimization. An optimizer that searches the entire backtest window may find parameters that work well in the dominant regime (trending or ranging) but fail badly in the other. Checking performance across both regimes prevents this. The avoiding overfitting guide covers this in detail.
Get Started with a Bollinger Bands Bot
Bollinger Bands are one of the more flexible tools in algorithmic trading. The mean reversion version suits traders who want higher win rates and more frequent entries. The breakout version suits traders comfortable with directional bets after volatility compression.
Both setups can be built and backtested in VolatiCloud without writing any code:
- Open the VolatiCloud console and create a new strategy
- Configure your BB conditions in the Strategy Builder
- Run backtests across multiple market regimes using the backtesting guide
- Optimize parameters with hyperparameter optimization
- Stress-test results with Monte Carlo simulation before committing real capital
For context on how Bollinger Bands compare to RSI for mean reversion setups, see the RSI mean reversion strategy guide. For context on combining BB with directional momentum signals, see the MACD strategy guide.