MACD Strategy Guide for Crypto Trading Bots: Three Signals, One Bot

MACD is built from two EMAs, yet it produces three distinct trading signals that many traders use interchangeably without understanding what each one actually measures. The line crossover tells you one thing. The zero-line cross tells you a different thing. Histogram divergence tells you something else entirely. Confusing them leads to conflicting entries, misread exits, and backtests that look promising but fall apart in live trading. This guide separates the three MACD signals, explains the 12/26/9 default parameters and where they break, and shows how to wire each one into a working strategy in VolatiCloud's Strategy Builder.
What MACD Actually Measures
MACD stands for Moving Average Convergence Divergence. The calculation is simpler than the name implies:
- MACD line: 12-period EMA minus 26-period EMA
- Signal line: 9-period EMA of the MACD line itself
- Histogram: MACD line minus Signal line
Because MACD is derived from EMAs, it inherits their characteristics. It's a trend-following, lagging indicator. When the 12-period EMA is above the 26-period EMA, the market has trended up recently and the MACD line is positive. When those conditions flip, MACD goes negative.
The signal line smooths the MACD line, adding another layer of lag. The histogram shows the momentum of that difference: how fast MACD is changing relative to its own recent average.
MACD doesn't tell you where price is. It tells you the difference between two trend estimates, and how fast that difference is changing.
This is a subtle but important distinction. RSI measures where price sits within a recent range. Bollinger Bands measure how far price has strayed from a rolling mean. MACD measures the relationship between two trend lines. This makes it a trend momentum indicator, not a mean reversion tool. Applying it as if it were RSI is one of the most common mistakes algorithmic traders make.
Typical MACD parameter values
- Fast EMA:
12(default),5–8for scalping,19+for slower swing setups - Slow EMA:
26(default),13–20for shorter trends,39+for position trading - Signal EMA:
9(default),5–7for earlier crossovers,12+for fewer false signals - Source:
close(default) - Best timeframes: 1h–4h for active strategies; daily for position trading
The Three MACD Signals
Signal 1: MACD/Signal line crossover
The most widely used MACD signal:
- Buy when the MACD line crosses above the Signal line
- Sell when the MACD line crosses below the Signal line
This is a double-smoothed trend signal. The crossover indicates that short-term trend momentum (MACD) has turned relative to its own recent average (Signal). It's slower than a simple EMA crossover. The 12/26/9 default parameters on daily charts mean you're capturing trends that unfold over several weeks.
A common refinement: only take buy crossovers when both lines are below zero, and sell crossovers when both are above zero. Crossovers while both lines sit on the same side of zero have historically lower success rates because they fire while the dominant trend is still intact.
Strengths: clear entry/exit signals, fewer whipsaws than raw price-based crossovers, good performance in trending markets.
Weaknesses: lags significantly; generates frequent false signals in sideways or choppy markets.
Signal 2: Zero-line cross
- Buy when the MACD line crosses from negative to positive (the 12-period EMA crosses above the 26-period EMA)
- Sell when the MACD line crosses from positive to negative
This is the underlying EMA crossover expressed through MACD. It's slower and more conservative than a Signal-line crossover, confirming a trend direction change with more conviction, but typically missing 30–40% of the move before signaling.
Zero-line crosses work best for longer-duration position entries. On daily charts with standard parameters, a trending market might produce only 4–8 zero-line crosses per year. That low frequency makes this signal better suited to swing or position trading than active algorithmic systems.
Signal 3: Histogram divergence
Divergence is the most powerful MACD signal — and the most frequently misapplied:
- Bullish divergence: price makes a lower low, but the MACD histogram makes a higher low — momentum is building even as price dips
- Bearish divergence: price makes a higher high, but the MACD histogram makes a lower high — momentum is fading even as price rises
Divergence flags exhaustion in the prevailing trend. It does not provide a precise entry point. It tells you the trend may be running out of fuel. Entering on divergence alone without a confirmation signal (a crossover, a volume spike, a candlestick pattern) is a common mistake.
Divergence signals can persist for weeks before price reverses. Use divergence to sharpen your attention on a pair, not to open positions unilaterally. Combine it with a crossover signal or another indicator for entry confirmation.
MACD Default Parameters: Why 12, 26, 9?
The 12/26/9 settings originated in commodity markets in the 1970s, calibrated for weekly charts covering roughly two weeks, one month, and two weeks of smoothing. They've survived because they work reasonably well across timeframes — not because they're mathematically optimal.
| Parameter | Default | Lower value effect | Higher value effect |
|---|---|---|---|
| Fast EMA | 12 | More responsive, more signals | Smoother, fewer signals |
| Slow EMA | 26 | Shorter trend window | Longer trend window |
| Signal | 9 | Earlier crossovers, more noise | Later crossovers, more lag |
Common alternative settings:
- Scalping (1h/4h charts):
3/10/16or5/13/8— faster response, more signals per day - Swing trading (daily charts):
19/39/9— reduces noise in range-bound periods - Position trading:
50/100/9— captures only the strongest multi-week trends
The only way to know what parameters work for a specific asset and timeframe is systematic backtesting. Forum recommendations and YouTube guides are a starting point at best.
Building a MACD Strategy in VolatiCloud
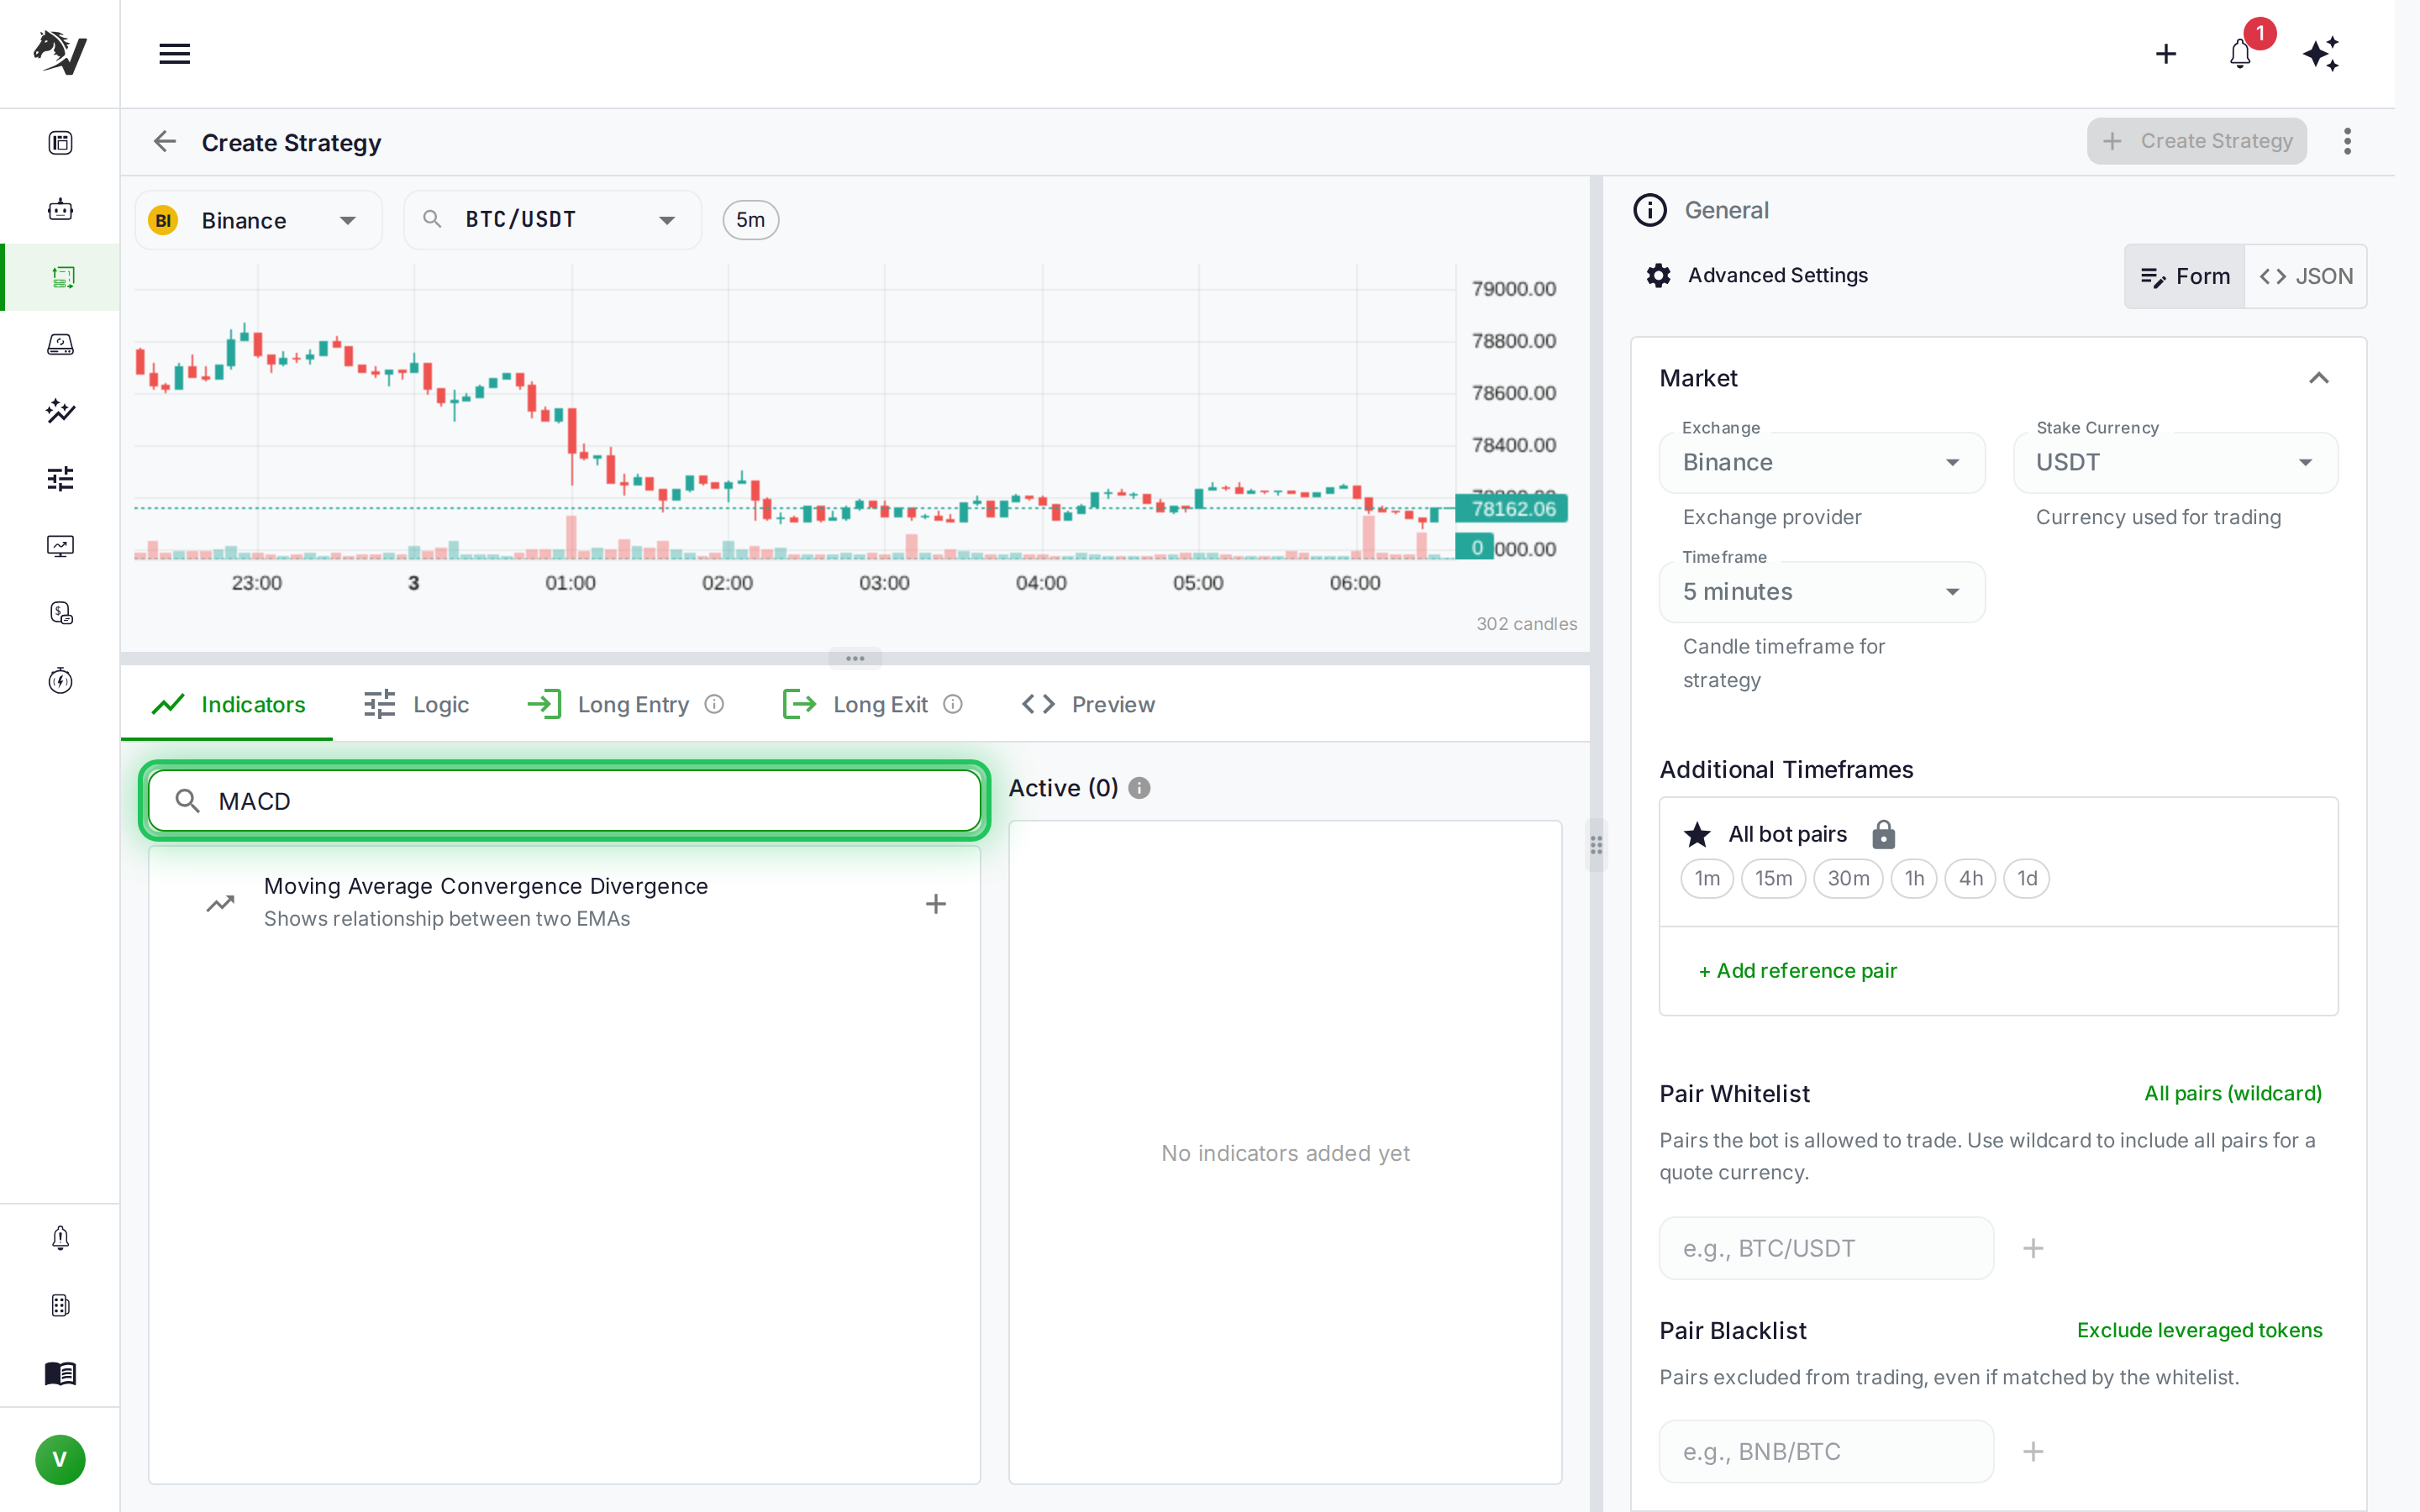
In the Strategy Builder, MACD conditions are built visually without writing code. The full indicator is available with configurable parameters, and it exposes three output values you can reference in conditions: macd (the MACD line), signal (the signal line), and histogram (the difference between them).
Basic MACD/Signal crossover entry
- Add a
CROSSOVERnode as your entry condition - Set the left operand to an Indicator node: select
MACD, output fieldmacd - Set the right operand to an Indicator node: select
MACD, output fieldsignal
This fires when the MACD line crosses above the Signal line.
Adding a zero-line filter
Wrap the crossover in an AND node:
- Condition A:
CROSSOVER— MACD over Signal (as above) - Condition B:
COMPARE— MACD line<0
This filter keeps only buy crossovers that fire while MACD is still below zero — typically the early part of a trend reversal, which historically produces the strongest follow-through.
Exit condition
Use a COMPARE node: MACD line < Signal line (exit when MACD drops back below Signal), or configure fixed stop-loss and ROI targets in the strategy parameters.
Once you've defined the strategy structure, VolatiCloud stores it as an immutable strategy version — testing different parameter combinations never overwrites a configuration that was working.
Backtesting MACD Strategies
MACD is a trend-following indicator, which means its performance varies dramatically across market regimes. Before backtesting, set the right expectations.
- Trending markets: MACD crossover strategies typically have a 40–55% win rate with a favorable win/loss ratio — many small losses, fewer but larger wins.
- Ranging markets: frequent crossover signals each produce small losses as price oscillates. The strategy bleeds out through transaction costs.
Check your backtest across multiple periods:
| Period | Market character | Expected MACD behavior |
|---|---|---|
| Strong uptrend | Directional move | Strong performance |
| Sustained downtrend | Directional move | Mixed — signals late at reversals |
| Choppy with short trends | Alternating | Moderate |
| Extended sideways | Range-bound | Poor |
Run backtests across at least 12 months to capture both trending and ranging periods. If you only backtest a trending period, the strategy parameters will be tuned to conditions that won't always hold. The avoiding overfitting guide covers why out-of-sample testing is essential before any MACD configuration reaches a live bot.
MACD metrics to focus on
- Profit factor above 1.3 as a minimum — the low win rate requires strong winning trades to compensate
- Max drawdown — MACD trend strategies can have extended losing streaks in choppy conditions
- Average bars in trade — if MACD is exiting trades after only 1–2 bars on average, the signal is too noisy for your timeframe
See analyzing backtest results for a breakdown of how to read each metric and running backtests for the step-by-step UI walkthrough.
Combining MACD with Other Indicators
MACD works better as part of a multi-indicator system than as a standalone signal. Effective combinations:
MACD + RSI. Use RSI to filter overextended entries. If MACD gives a buy signal while RSI is above 70, the price move has already run far. Skip that trade. The RSI mean reversion guide explains RSI behavior and how it complements trend signals.
MACD + Bollinger Bands. Take MACD crossover longs only when price is in the lower half of the Bollinger Band (below the midline). This reduces entries into already-extended moves. The Bollinger Bands strategy guide covers band interpretation in detail.
MACD + EMA trend filter. Only take buy signals when the 50- or 200-period EMA is sloping upward — trading with the primary trend. This single filter substantially reduces whipsaws in downtrending assets. Building on EMA crossover mechanics helps you understand why this filter works.
MACD + volume. Require above-average volume on the crossover bar to confirm the signal has real participation behind it. In VolatiCloud's Strategy Builder, the PRICE operand with the volume field gives you access to volume in your condition logic.
When MACD Fails — and How to Filter It
MACD's main weakness is low-volatility, range-bound markets. During these periods:
- MACD oscillates around zero without conviction
- Signal-line crossovers occur every few bars
- Each crossover produces a small loss before the next reversal
- Trading costs erode the account even when individual losses are small
Two practical filters address this:
ATR threshold filter. Only take MACD signals when the ATR (Average True Range) is above a minimum threshold. Below the threshold, the market doesn't have enough volatility for a trend to develop profitably, so skip all signals.
Histogram expansion filter. Only act on a MACD/Signal crossover when the histogram has been expanding (increasing in absolute value) for at least 2 consecutive bars before the crossover. This filters weak crossovers that fire as momentum is already fading, which is a common source of losing trades.
Both ATR and MACD's histogram output are available as indicator nodes in VolatiCloud's Strategy Builder, so either filter can be added to an existing strategy without restructuring the core logic.
Run a version of your strategy with each filter applied separately, then together. Backtesting the isolated effect of each filter tells you which one is doing the real work. This prevents over-engineering.
VolatiCloud's MACD Toolset
The three MACD output values (macd, signal, histogram) are all directly accessible as condition operands in VolatiCloud's Strategy Builder, which is not always the case on other platforms. Having all three enables the divergence-aware conditions and histogram momentum checks described above without requiring any custom code.
After building a MACD strategy structure, hyperparameter optimization can search the parameter space automatically. Set fast EMA to a range of 8–15, slow EMA to 20–32, and signal to 7–12, then let the optimizer find combinations that performed well over your backtest window. What would take hours of manual configuration runs in the background, leaving you to review results rather than run them.
Before putting any MACD configuration into a live bot, run it through Monte Carlo simulation to understand worst-case drawdown across thousands of trade-sequence permutations. MACD trend strategies can have extended losing periods in choppy markets. Monte Carlo tells you the shape of that worst case before real capital is at risk. For a stronger validation, walk-forward optimization tests parameter stability across multiple time windows.
A Practical MACD Starting Strategy
A straightforward MACD strategy to build and backtest on VolatiCloud:
- Open the Strategy Builder and create a new strategy
- Set the entry condition: MACD line crosses above Signal line, with a zero-line filter (MACD < 0 at entry)
- Configure stop-loss at
-5%and a trailing ROI exit - Run a backtest over 12+ months on your target pair and timeframe
- Analyze results — check profit factor, max drawdown, and average trade duration
- If metrics are promising, run hyperparameter optimization across fast/slow/signal ranges
- Validate with out-of-sample data before deploying a live bot
MACD is most effective when you understand which of its three signals you're using and why. Start with the Signal line crossover, backtest it in isolation, and only add filters after you understand the baseline behavior.
Start building your MACD strategy at console.volaticloud.com.