Real-Time Crypto Bot Monitoring with WebSocket Trade Events

A 30-second polling dashboard is fine until the moment your bot fills a trade at an unexpected price and you spend three poll cycles wondering whether the previous tick is real or just stale. VolatiCloud streams trade opens, closes, PnL changes, and runner status over a persistent WebSocket — every event arrives in under a second, and the equity curve redraws as soon as a position closes. No refresh, no polling, no waiting.
Why Real-Time Visibility Matters for Bot Trading
Most trading dashboards refresh on a timer — every 30 seconds, every minute, sometimes every five. For a 4-hour-timeframe trend strategy, that lag is usually fine. For a strategy that fires multiple trades in a window, or one you're actively validating against your backtest, polling latency means you're always one cycle behind reality.
The lag matters in three concrete situations:
- Debugging. If a trade opens at an unexpected price, you want to see it instantly — not after the next poll, by which point three more events have stacked up and the timeline is harder to read.
- Confidence. Watching a trade open and close in real time confirms your strategy is executing the way it was backtested. Lagged data leaves room for doubt that's hard to resolve.
- Incident response. When a bot transitions to error state, real-time updates cut the time between failure and your noticing it. On a fast-moving pair, two minutes of lag can be the difference between a contained loss and a runaway one.
VolatiCloud uses GraphQL WebSocket subscriptions throughout the monitoring interface. The connection stays open for the life of the dashboard tab, and updates push to your browser as the trading engine emits them.
What the Live Bot Monitoring Panel Shows
Opening a bot's detail page in the VolatiCloud console presents a live monitoring panel with several concurrent data streams. The full layout reference is in the bot monitoring docs.
Trade Events Feed
Every trade lifecycle event streams in real time:
| Event | What it means |
|---|---|
open_trade | Bot opened a new position — pair, entry price, stake amount |
close_trade | Position closed — exit price, profit/loss, duration |
cancelled_order | Order was placed but cancelled before fill |
status | Heartbeat: strategy name, timeframe, active trade count |
The feed is ordered chronologically, so you can watch a single trade move from entry through partial fills to close without refreshing the page. Each event includes a millisecond timestamp and the raw message from the trading engine, which is invaluable when you need to know exactly when a position opened relative to a candle close or an indicator crossover.
Live Equity Curve
The equity curve plots running profit over time. Each closed trade appends a new data point — a profitable close ticks the curve upward, a loss dips it. This is the same curve format you see in backtesting results, drawn live from real (or paper) execution.
Watching a live equity curve is one of the best early-warning systems for strategy drift. If the live curve starts diverging from what backtesting predicted, something has changed — market regime, exchange latency, or parameter sensitivity. The earlier you catch the divergence, the cheaper it is to investigate.
Bot Status and Health
The status panel shows current bot state — running, stopped, error, unhealthy, or dry_run. State transitions push immediately. If a bot moves to error because of an exchange API issue, the panel flips within seconds rather than on the next polling tick. The full state machine and what each transition means is documented in the bot lifecycle guide.
For bots running on self-hosted runners, you also see last-heartbeat timestamps and connection state. This tells you whether your runner is actively communicating with the VolatiCloud control plane — critical when diagnosing whether a "silent" bot is healthy or disconnected. The self-hosted vs cloud runners post covers runner architecture in depth.
Paper Trading vs Live: Same Monitoring Interface
VolatiCloud supports dry run (paper trading with simulated orders) and live (real capital) trading. The monitoring interface is identical for both — same trade feed, same equity curve, same status indicators, same WebSocket pipeline.
This consistency matters because it means your paper-trading window is a genuine rehearsal for live operation. You're not switching to a different UI when capital goes on the line; you're reading the same data in the same format. The transition from testing to production is familiar, which reduces the chance of misreading your dashboard at the worst possible moment. The full paper-trading-to-live framework walks through how to use that consistency to your advantage.
During a paper-trading window, the monitoring panel is where you confirm live execution matches your backtest expectations. Specifically, watch:
- Average trade duration. Should fall within the range your backtest showed for the same timeframe.
- Trade frequency. A strategy that fires significantly more or fewer trades than expected suggests timeframe or entry-condition misconfiguration.
- Profit factor. Absolute PnL is small in dry-run with minimal stake, but the ratio of gains to losses should approximate your backtest.
The backtesting deep dive covers the baseline metrics worth using as comparison targets.
Strategy Studio: Monitoring Inside the Builder
The Strategy Studio integrates monitoring directly into the strategy workflow. When you open a strategy that has active bots attached, the detail page shows a live summary: how many bots are running on this strategy, their aggregate PnL, and recent trade activity.
You don't need to navigate to a separate screen. Build a strategy, attach a bot, and watch live execution from the same interface where you defined the logic. The strategy detail page also shows which version of your strategy each bot is running, so when you've versioned a strategy after a parameter change, you can compare live performance across versions side by side. The strategy versioning post explains how versions and bots are bound together.
This view is particularly useful when paper-testing a strategy fork against the original. Both bots appear under their respective strategy versions, and both equity curves update in real time — making it trivial to see whether the fork actually improves on the parent.
Monitoring When You're Not at the Console
Real-time monitoring is useful when you're watching the dashboard. Bots run continuously, though, and you won't always be there. That's where the alert system fills the gap.
VolatiCloud's alerts hook directly into the same trade event stream the dashboard subscribes to. You can configure notifications for:
- A bot transitioning to
errorstate - A single trade loss exceeding a percentage of stake
- A trade opening outside expected hours
- Unusual trade frequency (more or fewer trades per hour than baseline)
- Drawdown crossing a threshold
Alerts deliver via email and webhook, so monitoring extends beyond the browser tab. The combination — real-time monitoring while you're watching, alerts while you're not — gives you the responsiveness of manual oversight without requiring you to watch charts all day. The intelligent alerts post covers configuration in depth.
Diagnosing Common Monitoring Signals
Real-time visibility is only useful if you know which patterns warrant attention. A few situations worth investigating immediately:
Equity curve flattening. The bot is running but not trading. Common causes: entry conditions aren't triggering (current market doesn't match the strategy's logic), stake amount exceeds available balance, or the bot is in cooldown after a losing trade.
Repeated cancelled_order events. The bot is attempting to open positions but orders aren't filling. Usually order book conditions — price moved before the order could fill, or the order type isn't supported for that pair on that exchange. Check exchange config and pair liquidity in the affected window.
Status cycling between running and error. Intermittent connectivity to the exchange API. Bots retry transient errors automatically, but repeated cycling suggests a persistent issue. Check API key permissions, rate-limit headroom, and whether the exchange reported downtime.
Trade duration much longer than backtested. Exit conditions aren't firing when they should. Compare current market conditions against the indicators your strategy depends on. The strategy detail page shows which version is running, so you can cross-reference with the exact parameters used in the original backtest.
Monitoring a Multi-Bot Portfolio
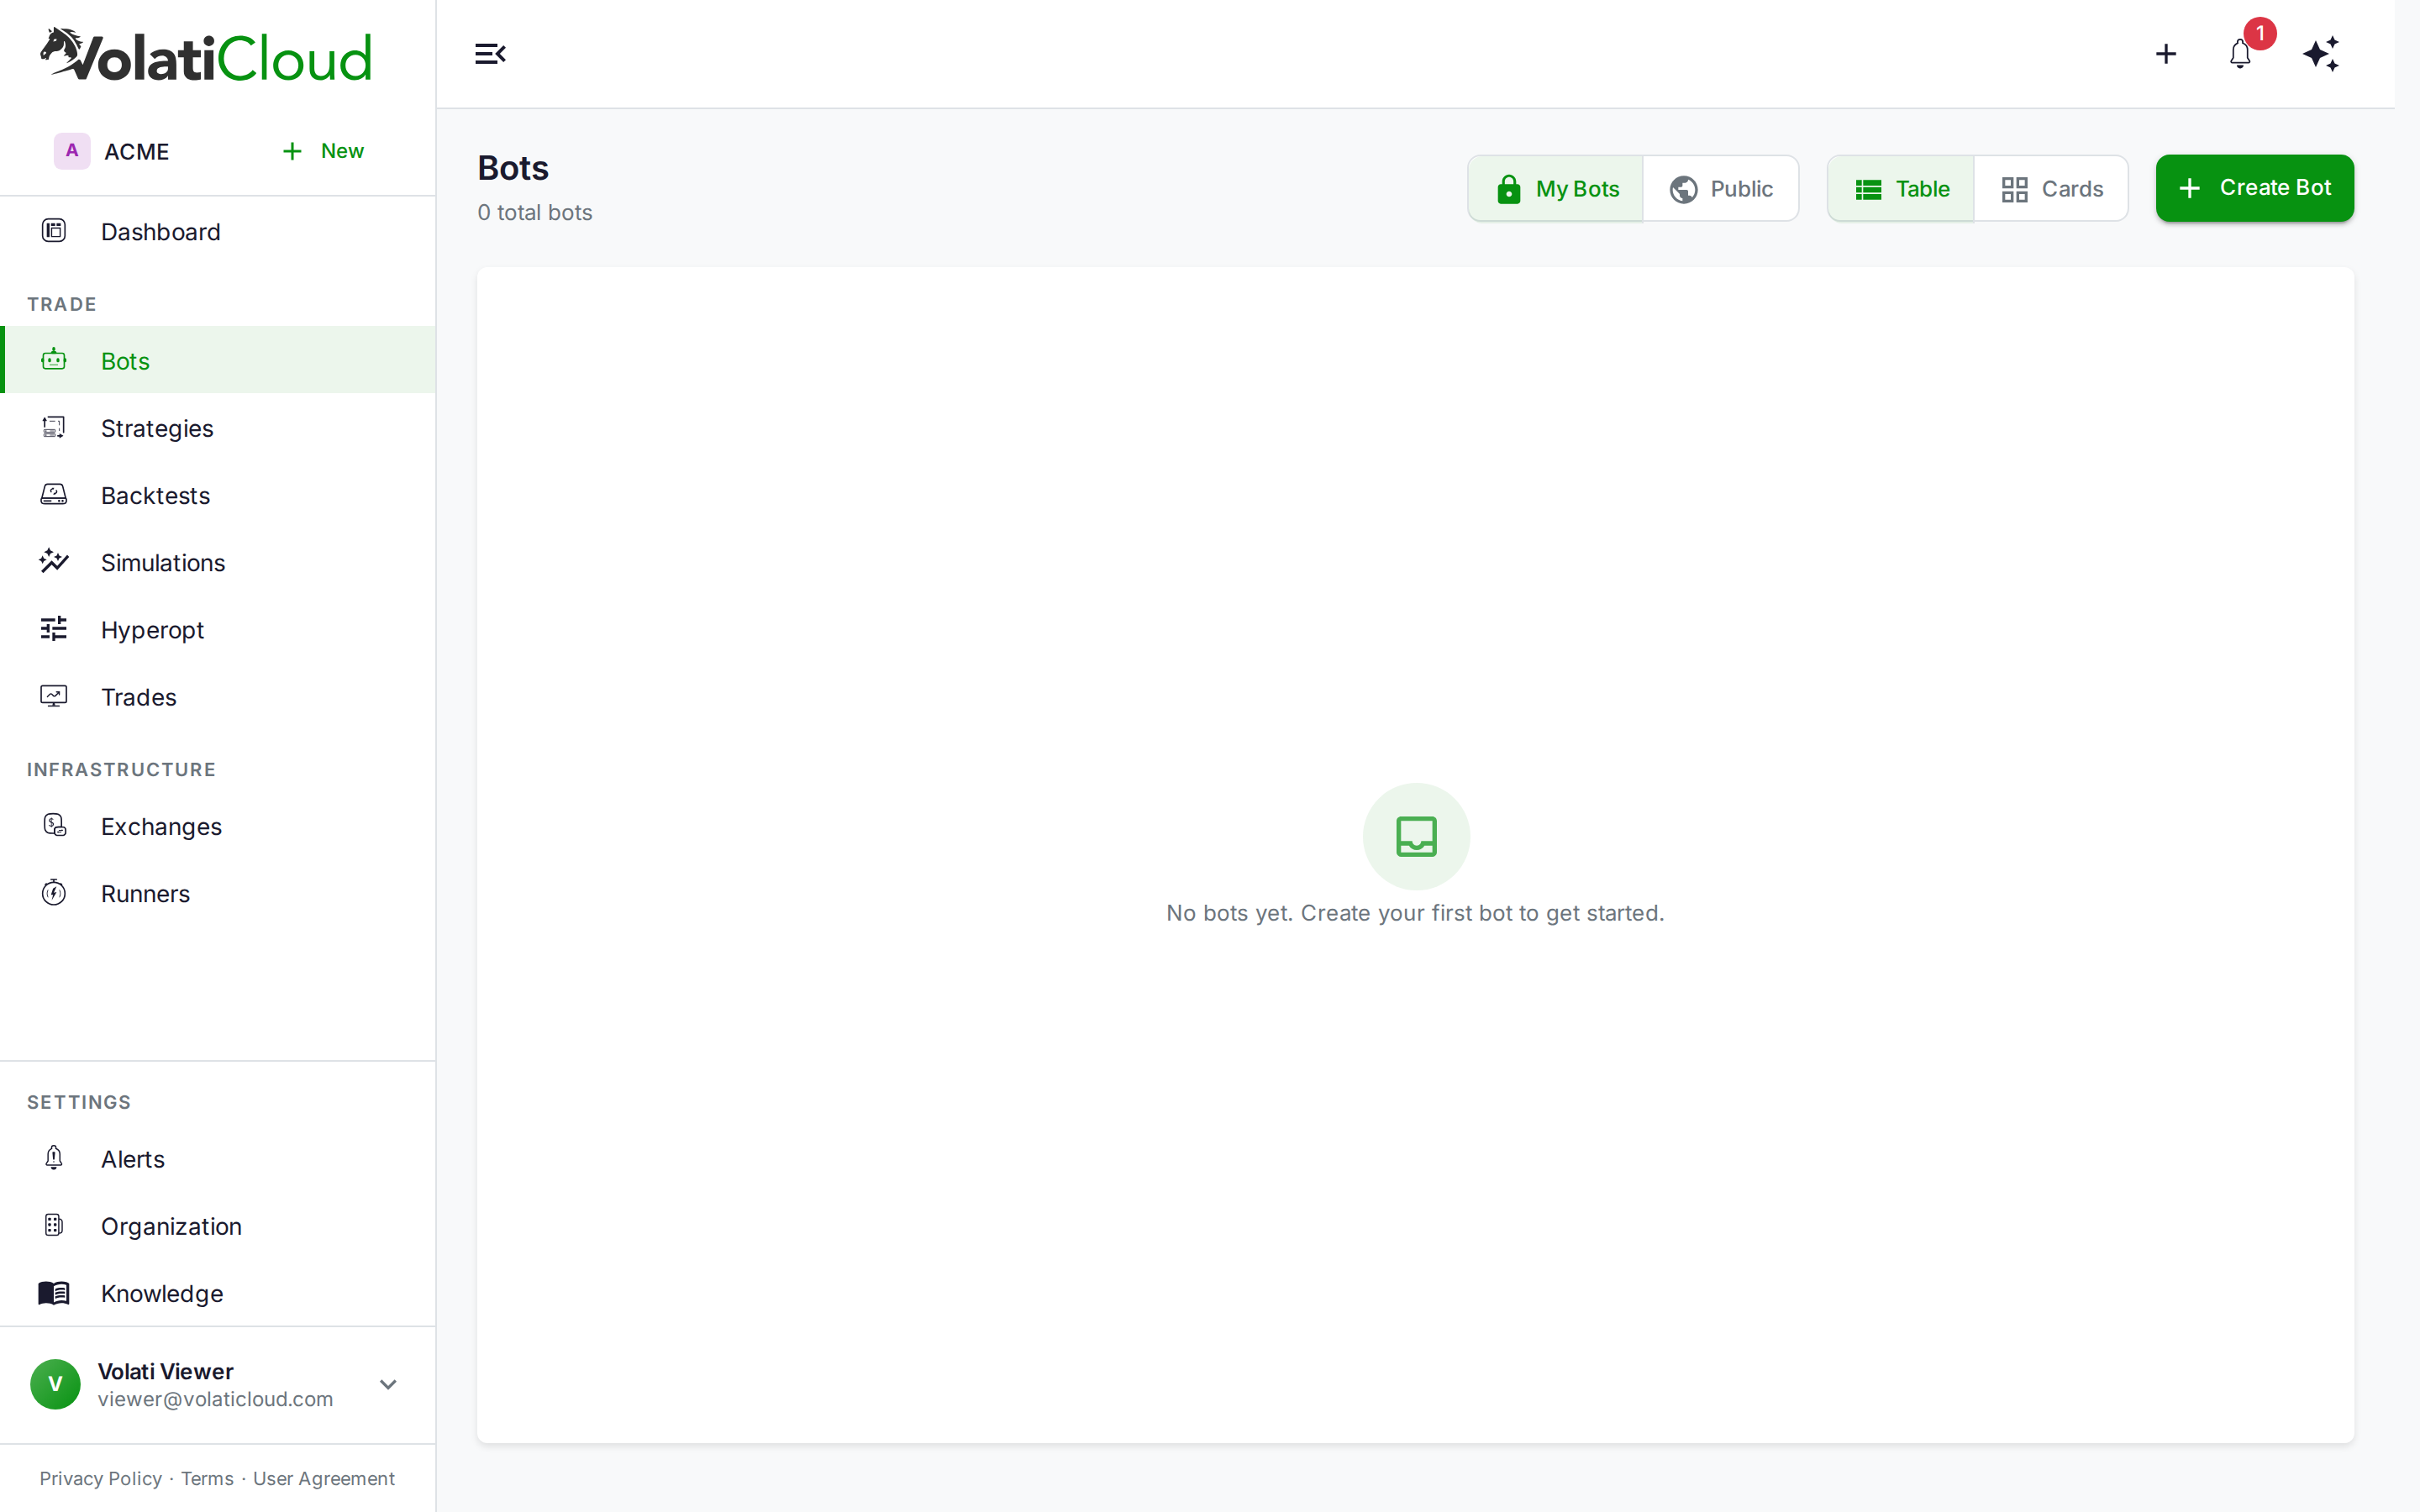
VolatiCloud supports running many bots simultaneously — different pairs, different exchanges, different strategy versions. The main bots list shows every running bot with current status and recent PnL, all updated in real time.
If you're running a portfolio (a trend-follower on BTC/USDT, a mean-reversion strategy on ETH/USDT, several altcoin positions), the summary view gives you a single place to confirm everything is healthy without opening each bot's detail page. The multi-bot portfolio orchestration guide goes deeper on running fleets coherently.
Bots are also grouped by runner — the infrastructure layer handling deployment. Runner health (connectivity, resource usage) is visible alongside bot-level monitoring, so when you investigate an issue you can quickly determine whether you're looking at a strategy problem or an infrastructure problem.
Get Started with Live Monitoring
Real-time monitoring is on by default for every bot, on every plan that includes bots — Starter, Pro and Enterprise, and the 7-day Pro trial. To activate it:
- Create a strategy in the Visual Strategy Builder or the code editor
- Connect an exchange — or skip this and use dry-run mode without live credentials
- Create a bot linking your strategy, exchange, and runner — the bot creation guide walks through each step
- Start the bot — the monitoring panel activates immediately and the WebSocket starts streaming events
The connection opens automatically when you navigate to the bot detail page. There is no separate configuration for monitoring; it's on by default.
If you're starting in dry-run (recommended before real capital), the monitoring experience is identical to live mode. Use the paper-trading window to build familiarity reading the event feed and equity curve, so when you switch to live trading you're interpreting familiar signals rather than learning a new interface under pressure.
Start at console.volaticloud.com — dry-run mode requires no exchange connection. Create a bot, start it in paper trading, and the monitoring panel activates the moment the bot transitions to running.