No-Code Crypto Strategy Builder: Visual Indicator Logic

Most traders have legitimate strategy ideas. They know that RSI below 30 after a 200-EMA cross is a structurally interesting setup. They know that ATR widens before breakouts. They know that volume confirming a reversal matters more than the reversal alone. The bottleneck has never been the idea — it's the gap between knowing what you want and writing 80 lines of pandas to express it. The Visual Strategy Builder closes that gap. Indicator nodes, comparison operators, AND/OR/NOT logic trees, all visual, all generating Freqtrade-compatible Python automatically.
What Is the No-Code Visual Strategy Builder
The Visual Strategy Builder is a drag-and-drop interface for creating algorithmic trading strategies — connecting condition nodes, picking indicators, defining entry/exit logic — without writing Python.
Internally, every visual configuration compiles to a real Freqtrade strategy class with populate_indicators, populate_entry_trend, and populate_exit_trend methods. You never have to read or edit that code unless you want to. When you do want to (custom callbacks, advanced DCA logic, machine-learning models), one click ejects to Code Mode with the visual configuration pre-rendered as Python.
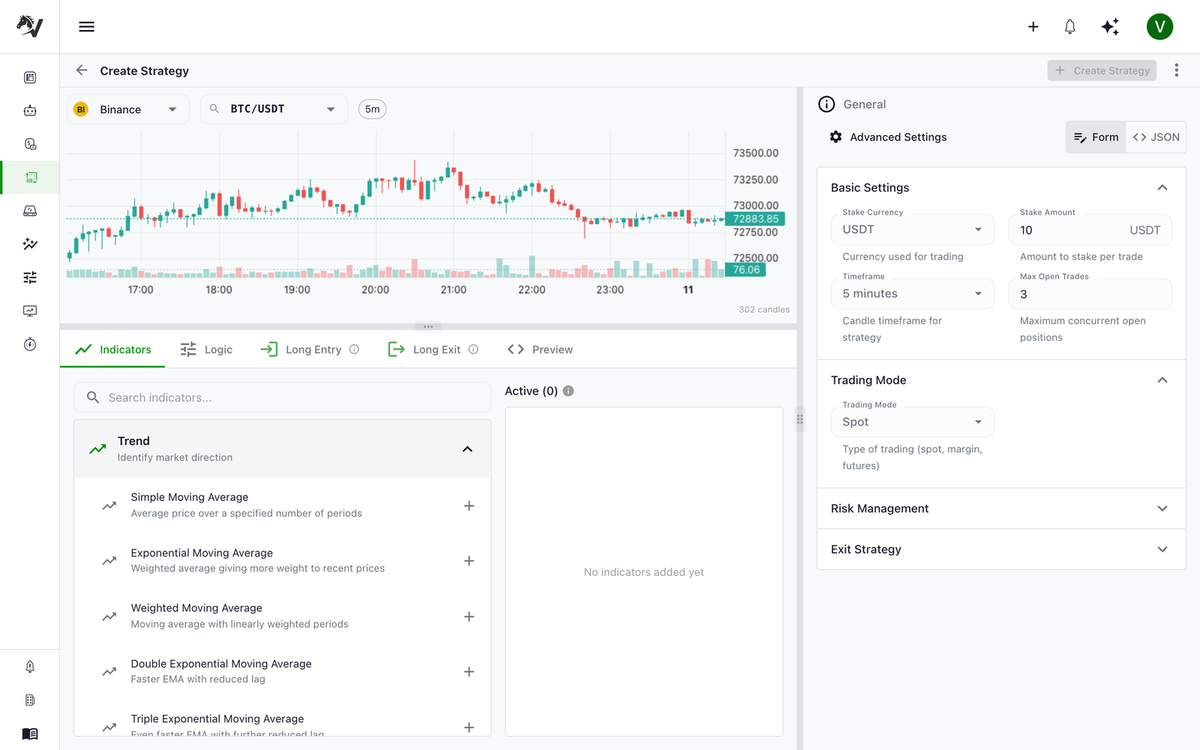
The builder lives on a single screen split into three regions: a live candlestick chart of the pair you're designing against (top-left), the indicator library and signal editor (lower panel), and a settings panel on the right covering trading mode, risk management, and exit behavior. Five tabs walk you through the full configuration:

How the Crypto Strategy Builder Works
Step 1: Choose Your Indicators
Pick from 25+ built-in technical indicators organized by category:
Trend
- Simple Moving Average (SMA), Exponential Moving Average (EMA)
- Weighted MA, Double EMA, Triple EMA, Kaufman Adaptive MA
Momentum
- RSI, MACD, Stochastic, Stochastic RSI
- Williams %R, CCI, Momentum, Rate of Change
Volatility
- Bollinger Bands, ATR, Keltner Channel
Volume
- OBV, MFI, CMF, Accumulation/Distribution
Trend confirmation / structure
- ADX, VWAP, Ichimoku Cloud, Parabolic SAR, Supertrend
Each indicator is fully configurable — period, multiplier, standard deviation, smoothing factor, anything the underlying TA-Lib function exposes. Deeper dives on the most common ones live in dedicated posts: RSI mean reversion, EMA crossover trend following, MACD strategy guide, Bollinger Bands strategy, and ATR stop-loss strategy.
Step 2: Define Entry Conditions
Build entry logic as a tree of conditions. The example below reads as: "Enter long when RSI is oversold AND price is above the 200 EMA AND MACD has just crossed over its signal line."
Logic node types available:
- AND — all child conditions must be true
- OR — at least one must be true
- NOT — invert a child condition
- COMPARE — compare two values with
>,<,=,>=,<=,!= - CROSSOVER / CROSSUNDER — detect indicator crosses on the current candle
- IN_RANGE — check whether a value falls between two bounds
Step 3: Define Exit Conditions
Same visual primitive, applied to position exits:
Take-profit and stop-loss are handled separately as risk-management settings, so exit conditions are usually about signal-driven exits (e.g., "the trend reversed") rather than risk-driven exits (e.g., "we hit −5%").
Step 4: Configure Position Management
The position-management settings panel covers the part of trading that isn't entry/exit signals:
- Leverage — fixed or dynamic, for margin/futures
- Stop-loss — fixed percentage or ATR-based
- DCA — dollar-cost-averaging ladders for DCA strategies
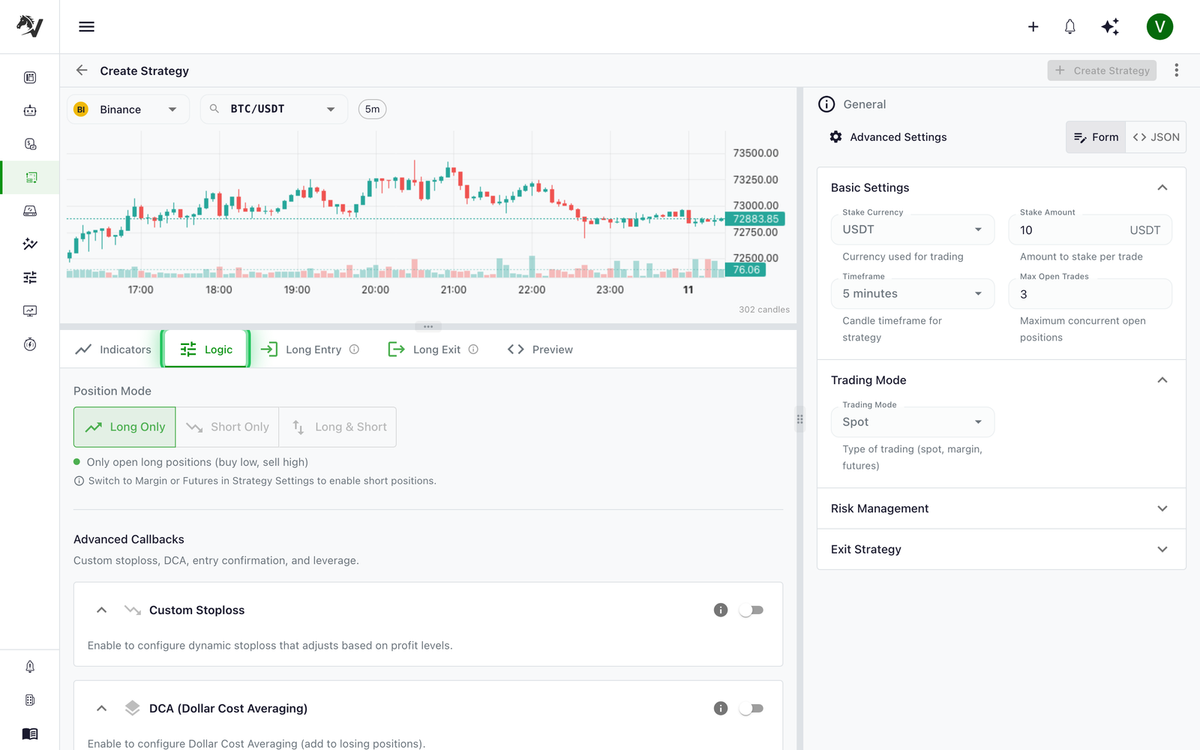
- Position mode — long-only, short-only, or both
All of this lives behind the Logic tab, alongside toggleable advanced callbacks for custom stoploss behavior, DCA ladders, leverage strategies, and confirmation checks before entry/exit:
Long/Short Strategies With Mirror Mode
For futures trading, the builder supports separate condition trees for long and short positions. Building both sides by hand is tedious — and a common source of bugs — so the builder also offers Mirror Mode: toggle it on and your long entry conditions are automatically inverted for shorts. The transformation is mechanical:
RSI < 30(long entry) →RSI > 70(short entry)CROSSOVERbecomesCROSSUNDER- Comparison operators flip (
>becomes<,>=becomes<=)
The full pattern, including when not to mirror, is in the long/short mirror mode post.
Preview the Generated Python Code
At any time, click the Preview tab to see the Python the visual configuration generates — rendered in a syntax-highlighted Monaco editor with proper freqtrade.strategy imports, typed parameters, and a fully-formed strategy class:
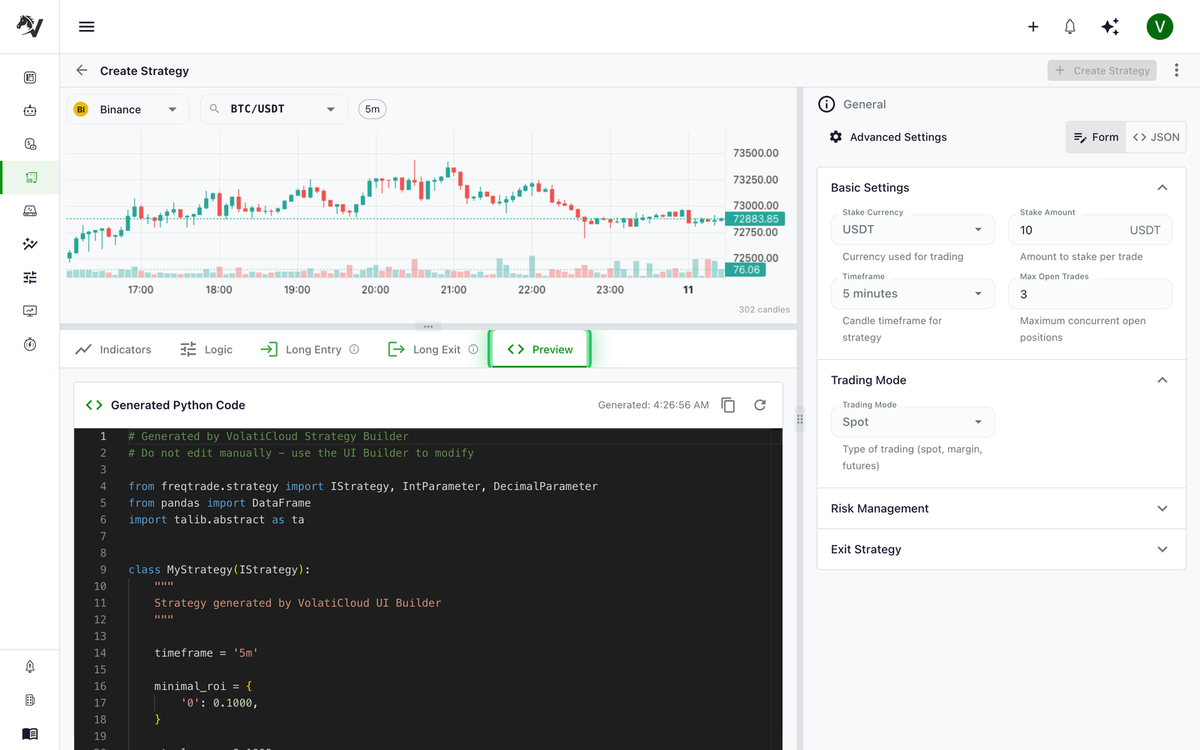
This is useful for:
- Learning Freqtrade strategy syntax by example
- Sanity-checking that the visual logic generates what you intended
- Sharing the strategy with technically-inclined teammates for review
- Migrating to Code Mode later without rebuilding from scratch
Ejecting to Code Mode for Advanced Logic
When you outgrow the visual layer — custom indicators, ML models, complex callbacks — eject to Code Mode:
- Click Eject to Code
- The generated Python opens in the in-app Monaco editor
- Continue developing with the full Freqtrade API:
custom_stoploss,confirm_trade_entry,adjust_trade_position,leverage,populate_indicatorswith TA-Lib or pandas-ta
Ejection is one-way for that strategy version. If you want to preserve the visual version for future edits, fork the strategy first — then eject the fork.
Real Example: RSI Mean Reversion With EMA Trend Filter
A practical starting point — RSI oversold with an EMA trend filter, the simplest robust mean-reversion configuration:
- Entry: Buy when
RSI(14) < 30ANDprice > EMA(200) - Exit: Sell when
RSI(14) > 70ORprice < EMA(50) - Stop-loss: −10% (or ATR-calibrated for the pair)
- Timeframe: 1h
Build this in the visual editor, preview the generated code, and run a backtest over 12+ months. If the metrics hold up, deploy it as a dry-run bot before going live. The paper trading to live promotion guide covers the full path.
Strategy Versioning and Forking
Once a backtest runs against a strategy, that strategy version becomes immutable — you can't silently change the conditions and pretend the old backtest still applies. To make changes, fork the strategy. Forking creates a new version that inherits the configuration, leaving the original (and all backtests against it) untouched. This is critical for:
- Comparing strategy variants against the same backtest period without confounds
- Maintaining an audit trail of which strategy version produced which trades
- Experimenting safely without losing a known-working baseline
The full versioning model is covered in the strategy versioning and forking post.
What the Builder Compiles To
For the technically curious, here's what a simple visual configuration compiles to in Code Mode:
from freqtrade.strategy import IStrategy
from pandas import DataFrame
import talib.abstract as ta

class RsiMeanReversion(IStrategy):
    timeframe = '1h'
    stoploss = -0.10

    def populate_indicators(self, df: DataFrame, metadata: dict) -> DataFrame:
        df['rsi'] = ta.RSI(df, timeperiod=14)
        df['ema_200'] = ta.EMA(df, timeperiod=200)
        df['ema_50'] = ta.EMA(df, timeperiod=50)
        return df

    def populate_entry_trend(self, df: DataFrame, metadata: dict) -> DataFrame:
        df.loc[
            (df['rsi'] < 30) & (df['close'] > df['ema_200']),
            'enter_long'
        ] = 1
        return df

    def populate_exit_trend(self, df: DataFrame, metadata: dict) -> DataFrame:
        df.loc[
            (df['rsi'] > 70) | (df['close'] < df['ema_50']),
            'exit_long'
        ] = 1
        return df
The generated code is real Freqtrade Python — readable, exportable, and indistinguishable from hand-written code. There is no proprietary runtime layer between the builder and Freqtrade.
Try the Visual Strategy Builder
Open the console, navigate to Strategies → New Strategy, and pick UI Builder mode. The builder is available on the Free plan, and the 7-day Pro trial adds the Pro feature set — enough to build a strategy, run backtests, and even try hyperparameter optimization.
Related guides
- UI Builder Guide — Full reference documentation for the visual strategy builder.
- Strategies Overview — Trading modes, position direction, and strategy concepts.
- Backtesting Overview — Validate your strategy against historical data before going live.