Stochastic Oscillator Strategy for Crypto: Time Entries with Momentum

Every crypto trader has seen the same trap: an asset looks oversold on RSI, you enter long, and price keeps falling another 20%. RSI was below 30, the setup looked clean — but something was missing. In many of those cases, the missing piece is momentum confirmation within range. The Stochastic Oscillator was built specifically to answer the question RSI leaves open: is the current close near the bottom of recent action, or is it still falling relative to where it just was? This guide walks through the four core Stochastic signals, the K=14 / D=3 default settings, the EMA trend filter that turns it into a production-grade entry trigger, and how to wire all of it into a working bot inside VolatiCloud's Strategy Builder.
What the Stochastic Oscillator Measures
The Stochastic Oscillator, developed by George Lane in the late 1950s, compares the current closing price to the price range over a lookback window. The core formula is:
%K = ((Close − Lowest Low) / (Highest High − Lowest Low)) × 100
Where Lowest Low and Highest High are taken over the past N periods (default: 14). The result is always between 0 and 100.
Reading %K directly: a value of 85 means the current close sits in the top 15% of the recent trading range. A value of 12 means it's near the bottom 12%. Unlike RSI, which measures the speed of price changes, Stochastic measures position within range.
The indicator produces two lines:
- %K — the raw calculation above, sometimes called the "fast" line
- %D — a 3-period simple moving average of %K, acting as a signal line
When %K is above %D, recent closes have been improving relative to their recent average — a bullish lean. When %K crosses below %D from above, momentum is weakening.
Typical Stochastic parameter values
- K period (lookback):
14(default),5–9for faster signals,20–30for smoother - D period (smoothing):
3(default),5–7for slower signal line - Oversold threshold:
20(default),15for stricter entries - Overbought threshold:
80(default),85for stricter exits - Source:
close(default),hlc3to reduce wick sensitivity - Best timeframes: 1h–4h for active strategies; 15m for higher-frequency setups
Stochastic vs RSI: Different Questions, Complementary Answers
Both indicators oscillate between 0 and 100, both have overbought/oversold zones, and both are widely used for mean-reversion entries. Choosing between them — or combining them — depends on what question you're asking.
| RSI | Stochastic | |
|---|---|---|
| Measures | Speed and magnitude of price changes | Position of close within recent high-low range |
| Overbought threshold | 70 | 80 |
| Oversold threshold | 30 | 20 |
| Signal types | Level crossings, divergences | %K/%D crossovers, zone exits |
| Responds faster to | Strong directional moves | Rapid range compression |
| Better in | Trending markets | Ranging/choppy markets |
| Noisier in | Sideways chop | Strong trends |
The key practical difference: RSI can stay "overbought" (above 70) for extended periods during strong uptrends. Stochastic, because it's anchored to the recent high-low range, will compress toward 100 in a trend and produce more frequent crossovers. That makes Stochastic more useful for timing entries in range-bound markets — and more prone to false signals in a strong trend without additional filtering.
This is why many algo traders combine both: RSI confirms the broader momentum context, Stochastic times the specific entry. The RSI mean reversion strategy guide covers RSI in depth and pairs naturally with this post.
Reading the Four Core Stochastic Signals
1. Overbought / oversold zones
When %K climbs above 80, the asset is closing near the top of its recent range — a potential reversal zone. When %K falls below 20, it's closing near the bottom. These levels are not automatic entry signals; they indicate where to look, not what to do.
In a strong uptrend, %K can hover near 80–100 for days or weeks without a meaningful reversal. Entering short just because Stochastic crossed above 80 during a bull run is one of the most common Stochastic mistakes. Always check the higher-timeframe trend before acting on overbought/oversold readings.
2. %K/%D crossover
The most widely traded signal: when %K crosses above %D while both are in the oversold zone (below 20), it suggests momentum is turning up from a depressed range position. When %K crosses below %D while both are in the overbought zone (above 80), momentum may be rolling over from the top.
The qualifier — "while in the zone" — matters. A %K/%D crossover in the middle of the range (say, between 40 and 60) carries much less information.
3. Zone exit
A secondary confirmation: wait not just for the %K/%D crossover, but for %K to actually exit the oversold zone (cross back above 20 from below). This adds a small lag but filters out crossovers that immediately reverse.
4. Divergence
When price makes a lower low but Stochastic makes a higher low, bullish divergence suggests selling momentum is weakening even as price dips. This works the same as MACD divergence, and both can be combined for higher-confidence signals. Divergence signals are harder to implement in automated systems but are worth testing.
Stochastic RSI: Speed Without Compromise
VolatiCloud's Strategy Builder includes Stochastic RSI (STOCH_RSI) as a distinct indicator. StochRSI applies the Stochastic formula to RSI values rather than raw price, producing an oscillator that is faster and more sensitive.
StochRSI = (RSI − Lowest RSI) / (Highest RSI − Lowest RSI)
The result oscillates between 0 and 1 (or 0–100 when scaled), and it reaches overbought/oversold levels far more frequently than either RSI or standard Stochastic alone. That makes it useful for higher-frequency strategies that need more frequent entry signals — but it also generates more noise. For swing trading timeframes (4h, daily), standard Stochastic is usually preferable. For 15-minute or 30-minute bots, StochRSI is worth testing.
Building a Stochastic Strategy in VolatiCloud
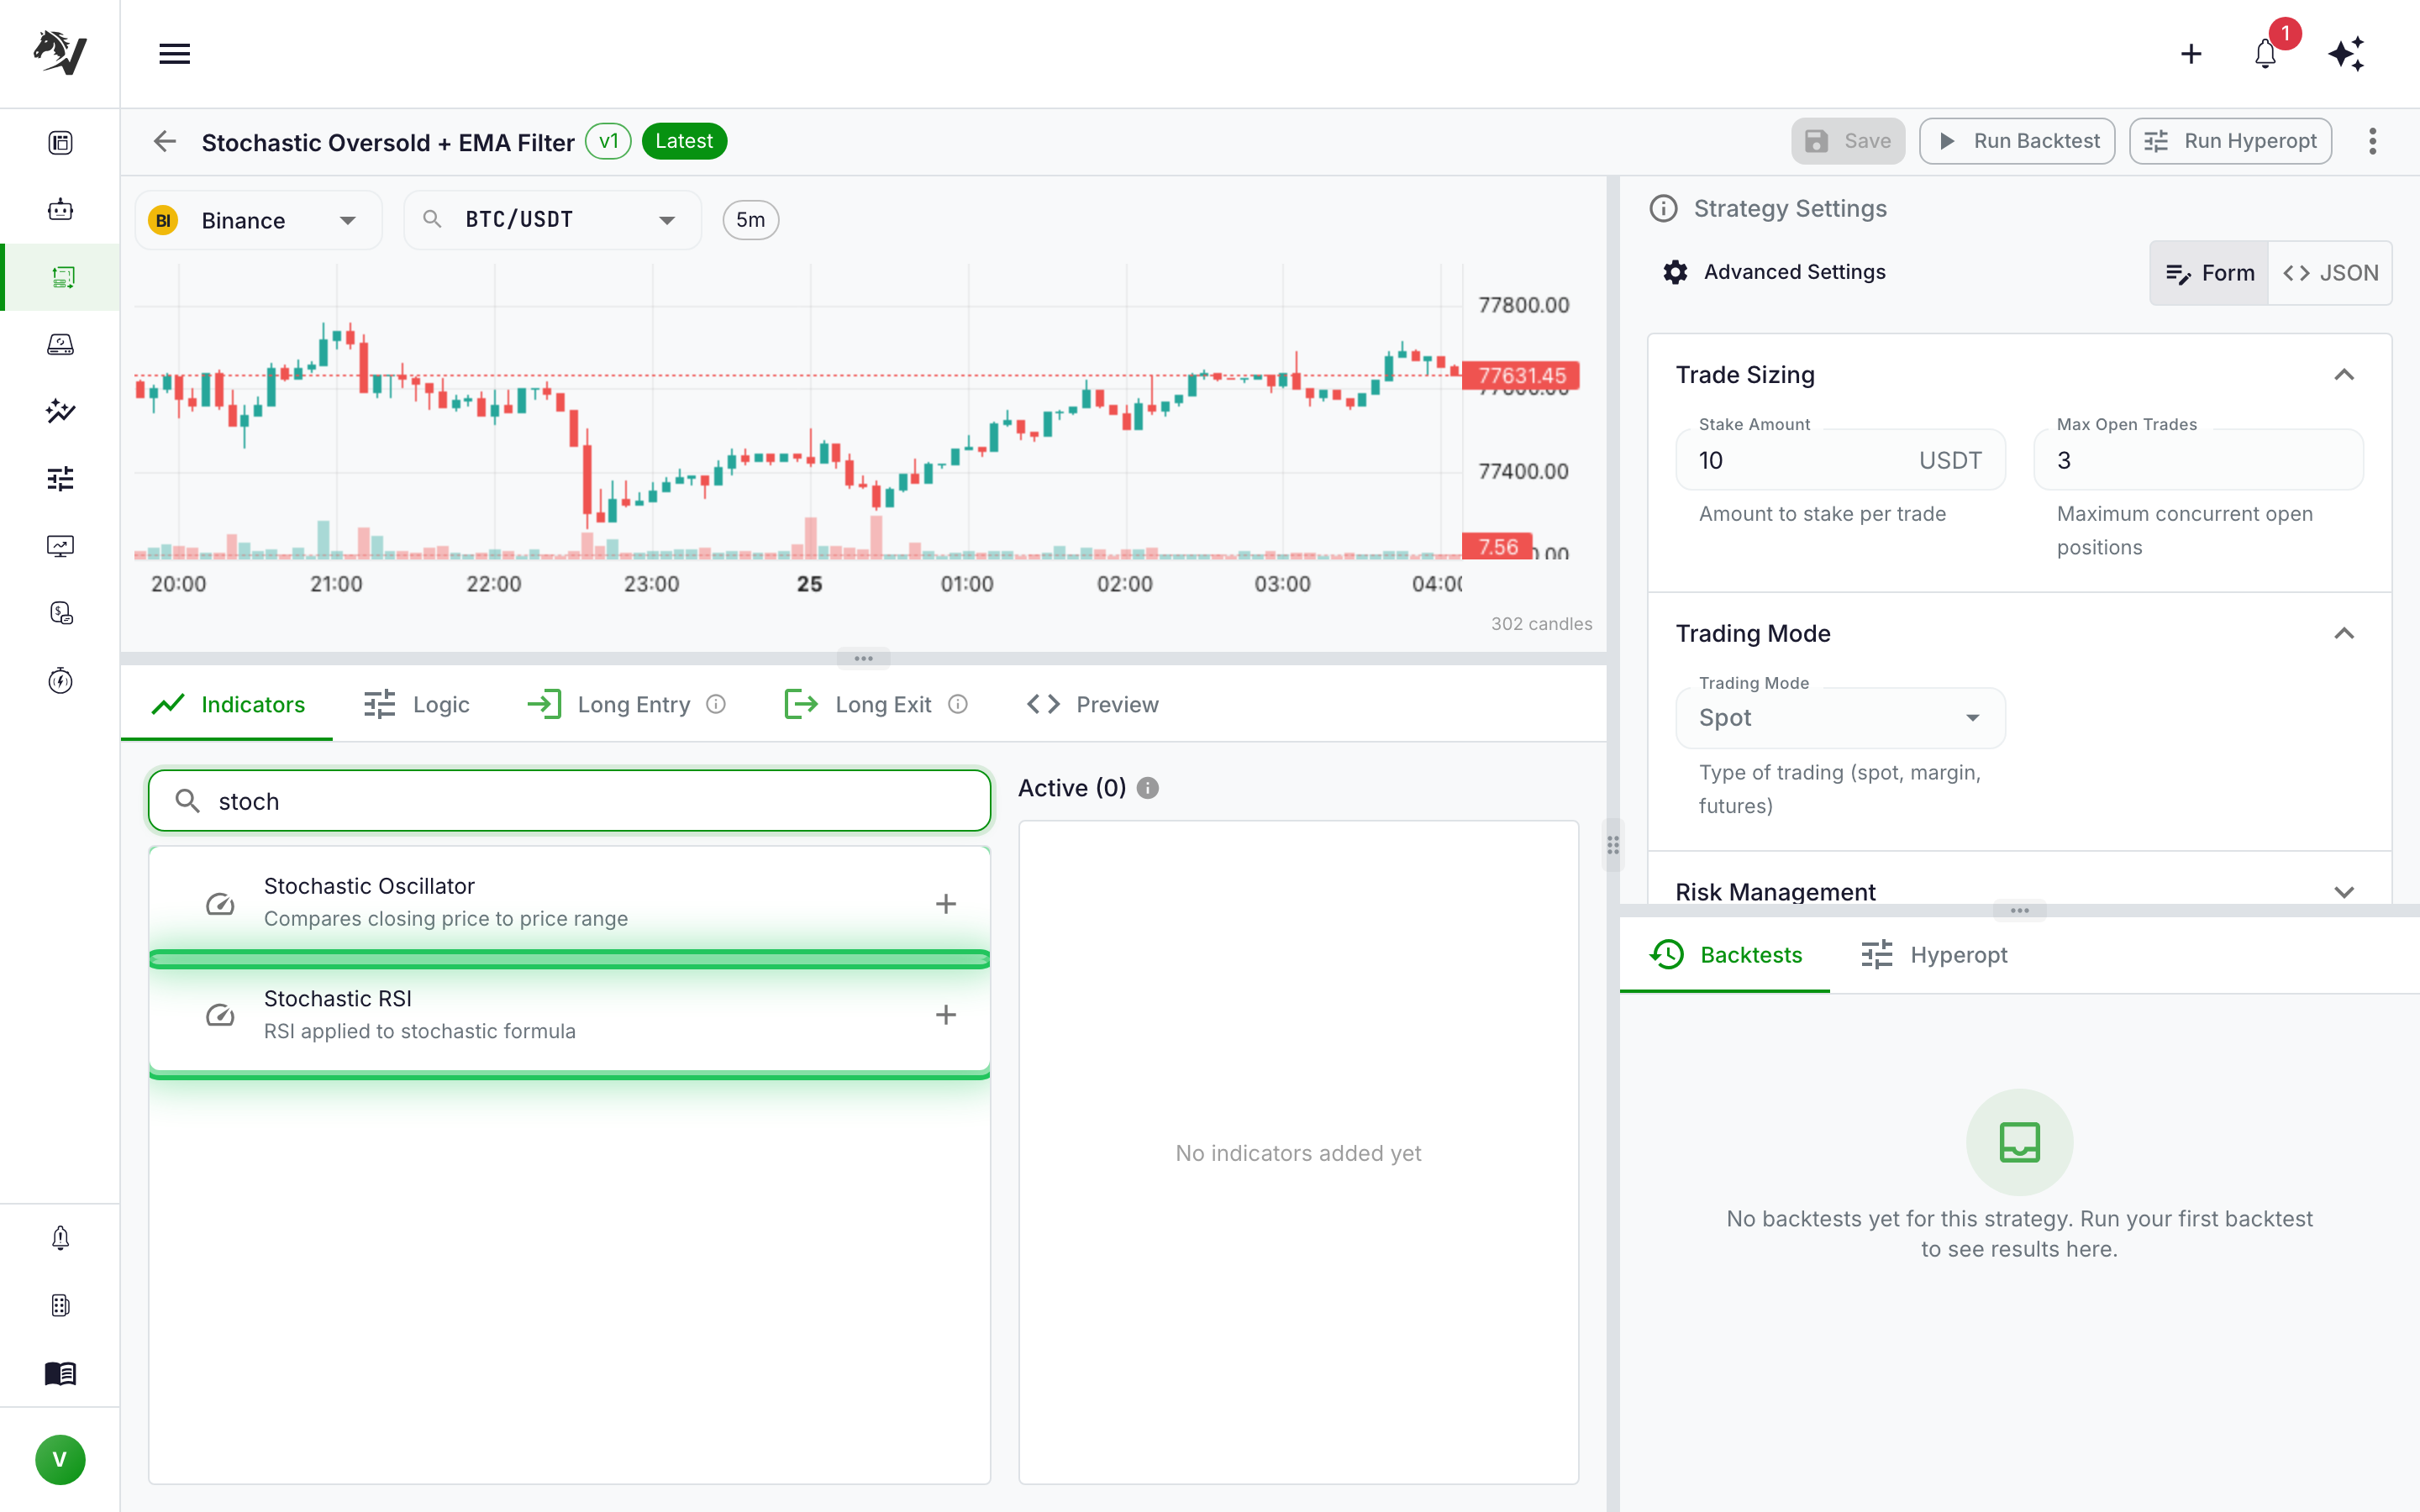
The Strategy Builder exposes both STOCH and STOCH_RSI in the Indicators panel. When you add a Stochastic indicator node, you configure:
- Period (K period) — lookback window for %K calculation. Default 14; shorter periods (5–9) respond faster but add noise; longer periods (20–30) smooth out false signals.
- Smoothing (D period) — the MA applied to %K to produce %D. Default 3; increasing to 5 or 7 slows the signal line.
- Price field — typically
close, thoughhlc3(average of high, low, close) can reduce sensitivity to wicks.
A minimal long-entry condition using Stochastic:
%K < 20                  # in oversold zone
AND %K crosses above %D  # momentum turning up
In the UI Builder, this translates to a COMPARE node for the zone check combined with a CROSSOVER node for the signal. You then set the entry condition to require both nodes to be true simultaneously.
This basic setup works but tends to produce many false entries in trending markets. The next section adds a filter that significantly improves its reliability.
A Practical Strategy: Stochastic Oversold + EMA Trend Filter
The combination of a Stochastic entry signal with an EMA trend filter is one of the cleaner applications of the indicator. The logic is straightforward.
Entry conditions (long):
- Price is above the 200-period EMA (uptrend confirmed on the analysis timeframe)
- Stochastic %K is below 20 (pullback into oversold territory)
- %K crosses above %D (momentum starting to recover)
Exit conditions:
- Take profit at 1.5× to 2× the entry's ATR
- Trailing stop at 1× ATR from high watermark
- Or: exit when Stochastic %K crosses above 80 (overbought) and then crosses back below 80
This approach only trades pullbacks within an uptrend — avoiding the classic Stochastic trap of fading a strong trend. The 200 EMA acts as a regime filter: if price is below the 200 EMA, the bot sits on its hands. The same trend-filter principle is covered in the EMA crossover strategy guide and the Bollinger Bands strategy guide.
You can also mirror this for short entries with VolatiCloud's long/short mirror mode: price below 200 EMA, Stochastic above 80, %K crosses below %D — auto-generated from the long conditions.
The EMA period matters. On a 1-hour chart, 200 periods covers roughly 8 days — a reasonable medium-term trend filter. On a 15-minute chart, 200 periods is only 50 hours. Adjust the EMA period to fit the trend horizon you're targeting, not just the candle interval.
Backtesting Stochastic Parameters in VolatiCloud
When you take a Stochastic strategy to the backtester, the main parameters to explore are the K period, D period, and overbought/oversold thresholds. These interact in ways that aren't always intuitive.
A few observations from testing Stochastic strategies across crypto pairs:
- Shorter K periods (5–9) work better on shorter timeframes (15m, 30m) where you want faster signal generation
- Standard K=14, D=3 is the most common and a reasonable default for 1h timeframes
- Lowering the oversold threshold from 20 to 15 reduces signal frequency but often improves win rate, since you're waiting for deeper pullbacks
- Raising the overbought threshold from 80 to 85 similarly filters out early trend-reversal signals
VolatiCloud's hyperparameter optimization can search across all of these systematically — the parameter space typically looks like:
{
  "stoch_k": { "type": "int", "low": 5, "high": 21, "step": 1 },
  "stoch_d": { "type": "int", "low": 3, "high": 7, "step": 1 },
  "oversold": { "type": "int", "low": 15, "high": 25, "step": 1 },
  "overbought": { "type": "int", "low": 75, "high": 85, "step": 1 }
}
After running a backtest, see analyzing backtest results for how to read the key metrics: profit factor, max drawdown, win rate, and average trade duration. A Stochastic strategy with a 55% win rate and a 1.8 profit factor is meaningfully different from one with a 65% win rate and a 0.9 profit factor — the second is likely curve-fit.
Common Stochastic Mistakes to Avoid
Ignoring the trend. The most common error. Stochastic oversold in a downtrend is not a buy signal — it's a description of where price is within a collapsing range. Always filter with a trend indicator.
Treating every crossover as equal. A %K/%D crossover at 15 (deep oversold) is more significant than one at 25 (mild pullback). Use the zone context.
Using it as a standalone indicator. Stochastic shows range position. It does not show volume, trend direction, or volatility context. Combine it with at least one other type of indicator (trend, volatility, or volume) before trading it live.
Over-optimizing the periods. If your best backtest result uses K=7, D=4, oversold=17 and the next-best uses K=12, D=3, oversold=20, the difference in performance is likely noise. Test across a range of neighboring parameters — if performance collapses as soon as you move away from a specific combination, you've probably overfit. The avoiding overfitting guide covers this in detail.
Using it on always-trending assets. Bitcoin in a strong bull run spends more time at Stochastic >80 than it does cycling through overbought/oversold. Stochastic is more useful on altcoins with defined ranges or during BTC consolidation phases.
Stochastic in VolatiCloud's Strategy Builder
VolatiCloud supports both STOCH and STOCH_RSI natively in the visual Strategy Builder. You can configure the indicator parameters, connect its output to comparison and crossover nodes in the logic tree, and combine it with EMA, ATR, or any other indicator from the full library — no code required.
For strategies that need a more customized Stochastic implementation (for example, using the zone-exit signal rather than the basic crossover, or implementing divergence detection), the Code Mode gives you direct access to Python and the full technical-analysis library that Freqtrade uses under the hood.
Once your strategy is built, run it through the backtester with a date range that covers both trending and ranging market conditions — ideally including at least one significant market correction. Stochastic strategies that only work in calm, ranging conditions will fail badly during strong trend phases, so your test window needs to include both regimes.
Get Started with a Stochastic Bot
Ready to build your first Stochastic strategy? Open the Strategy Builder in VolatiCloud and add a STOCH indicator node. Pair it with an EMA trend filter, run a backtest over 6–12 months of data, then use walk-forward optimization to confirm your parameters hold up on out-of-sample data.
If you're new to building indicator-based strategies, start with the UI Builder walkthrough before diving into parameter tuning.