Build a Crypto Trading Journal From Your Bot's Own Data

Most trading journals die within two weeks. Not because traders lack discipline, but because the journal asks them to manually re-type information their platform already recorded — entry price, exit price, the reason for the trade, what the market was doing. A crypto trading bot changes that equation: the data is already there, and the journal becomes a matter of annotation, not transcription.
Why "Keep a Trading Journal" Advice Usually Fails
Every trading education resource tells you to journal. Almost none of them survive contact with a busy week. The typical failure mode looks like this: you open a spreadsheet after a manual trade, fill in five columns, feel virtuous, and then skip the next eight trades because you were watching the chart instead of writing about it. Three weeks later the spreadsheet has four rows and you've stopped opening it.
The problem isn't motivation — it's that manual journaling asks you to be two people at once: the trader making decisions in real time, and the analyst recording them accurately afterward. Those two jobs compete for the same attention, and the trading always wins.
Automated trading removes the conflict. A bot executes the plan exactly as configured, closes the trade, and logs the result without needing you to be paying attention at 3 AM. The journal's job shifts from "record what happened" to "decide what the record means" — a much easier habit to sustain because it can happen once a week instead of after every trade.
The Four Things a Useful Trading Journal Actually Needs
A journal that only lists win/loss and P&L per trade doesn't teach you anything a broker statement wouldn't. To actually improve a strategy over time, a journal needs four layers of information:
| Layer | What it captures | Where it comes from |
|---|---|---|
| Hypothesis | Why you believe the strategy should work, and under what market conditions | Your backtest setup and notes |
| Expected behavior | The metrics the backtest predicted — win rate, average trade, max drawdown | Backtest results |
| Actual behavior | What the strategy did once real capital and real fills were involved | Live trade history and bot P&L |
| Divergence notes | Where actual behavior departed from expected, and why | Your weekly review |
Most journaling templates only cover the third layer — a list of trades. That's necessary but not sufficient. Without the hypothesis and expected-behavior layers, you have no baseline to compare live results against, so "the bot lost money this week" has no context: is that normal variance within the backtested drawdown range, or a sign the strategy stopped working?
Start the Journal at the Backtest, Not the First Live Trade
The first journal entry for any strategy should happen before a single live trade fires — when you run the initial backtest. At that point, write down three things:
- The hypothesis in one sentence. "RSI(14) oversold entries with an EMA(200) trend filter should catch mean-reversion bounces in a ranging BTC/USDT market."
- The conditions under which you expect it to fail. Every strategy has a market regime it isn't built for — trend-following systems bleed in chop, mean-reversion systems bleed in strong trends. Naming the failure condition up front stops you from rationalizing it away later.
- The backtest's headline numbers, pulled straight from the results page: win rate, profit factor, max drawdown, and trade count. These become your comparison baseline once the bot goes live.
This is the same discipline covered in avoiding overfitting in backtests — a strategy that only looks good on the exact historical window you tuned it on won't survive contact with new data, and a pre-committed hypothesis is one of the simplest defenses against fooling yourself after the fact.
Write the hypothesis before you see how the backtest performs, not after. If you write it retroactively to match good backtest numbers, you're describing what happened, not predicting it — and prediction is the entire point of a hypothesis.
Your Live Trades Already Write Most of the Entry
Once a bot is running, the second and third journal layers largely fill themselves. Every bot's detail view keeps a running list of closed trades — entry and exit price, duration, realized P&L, and the pair traded — without you doing anything beyond letting the bot run. The bot monitoring guide covers what's tracked in that view in full.
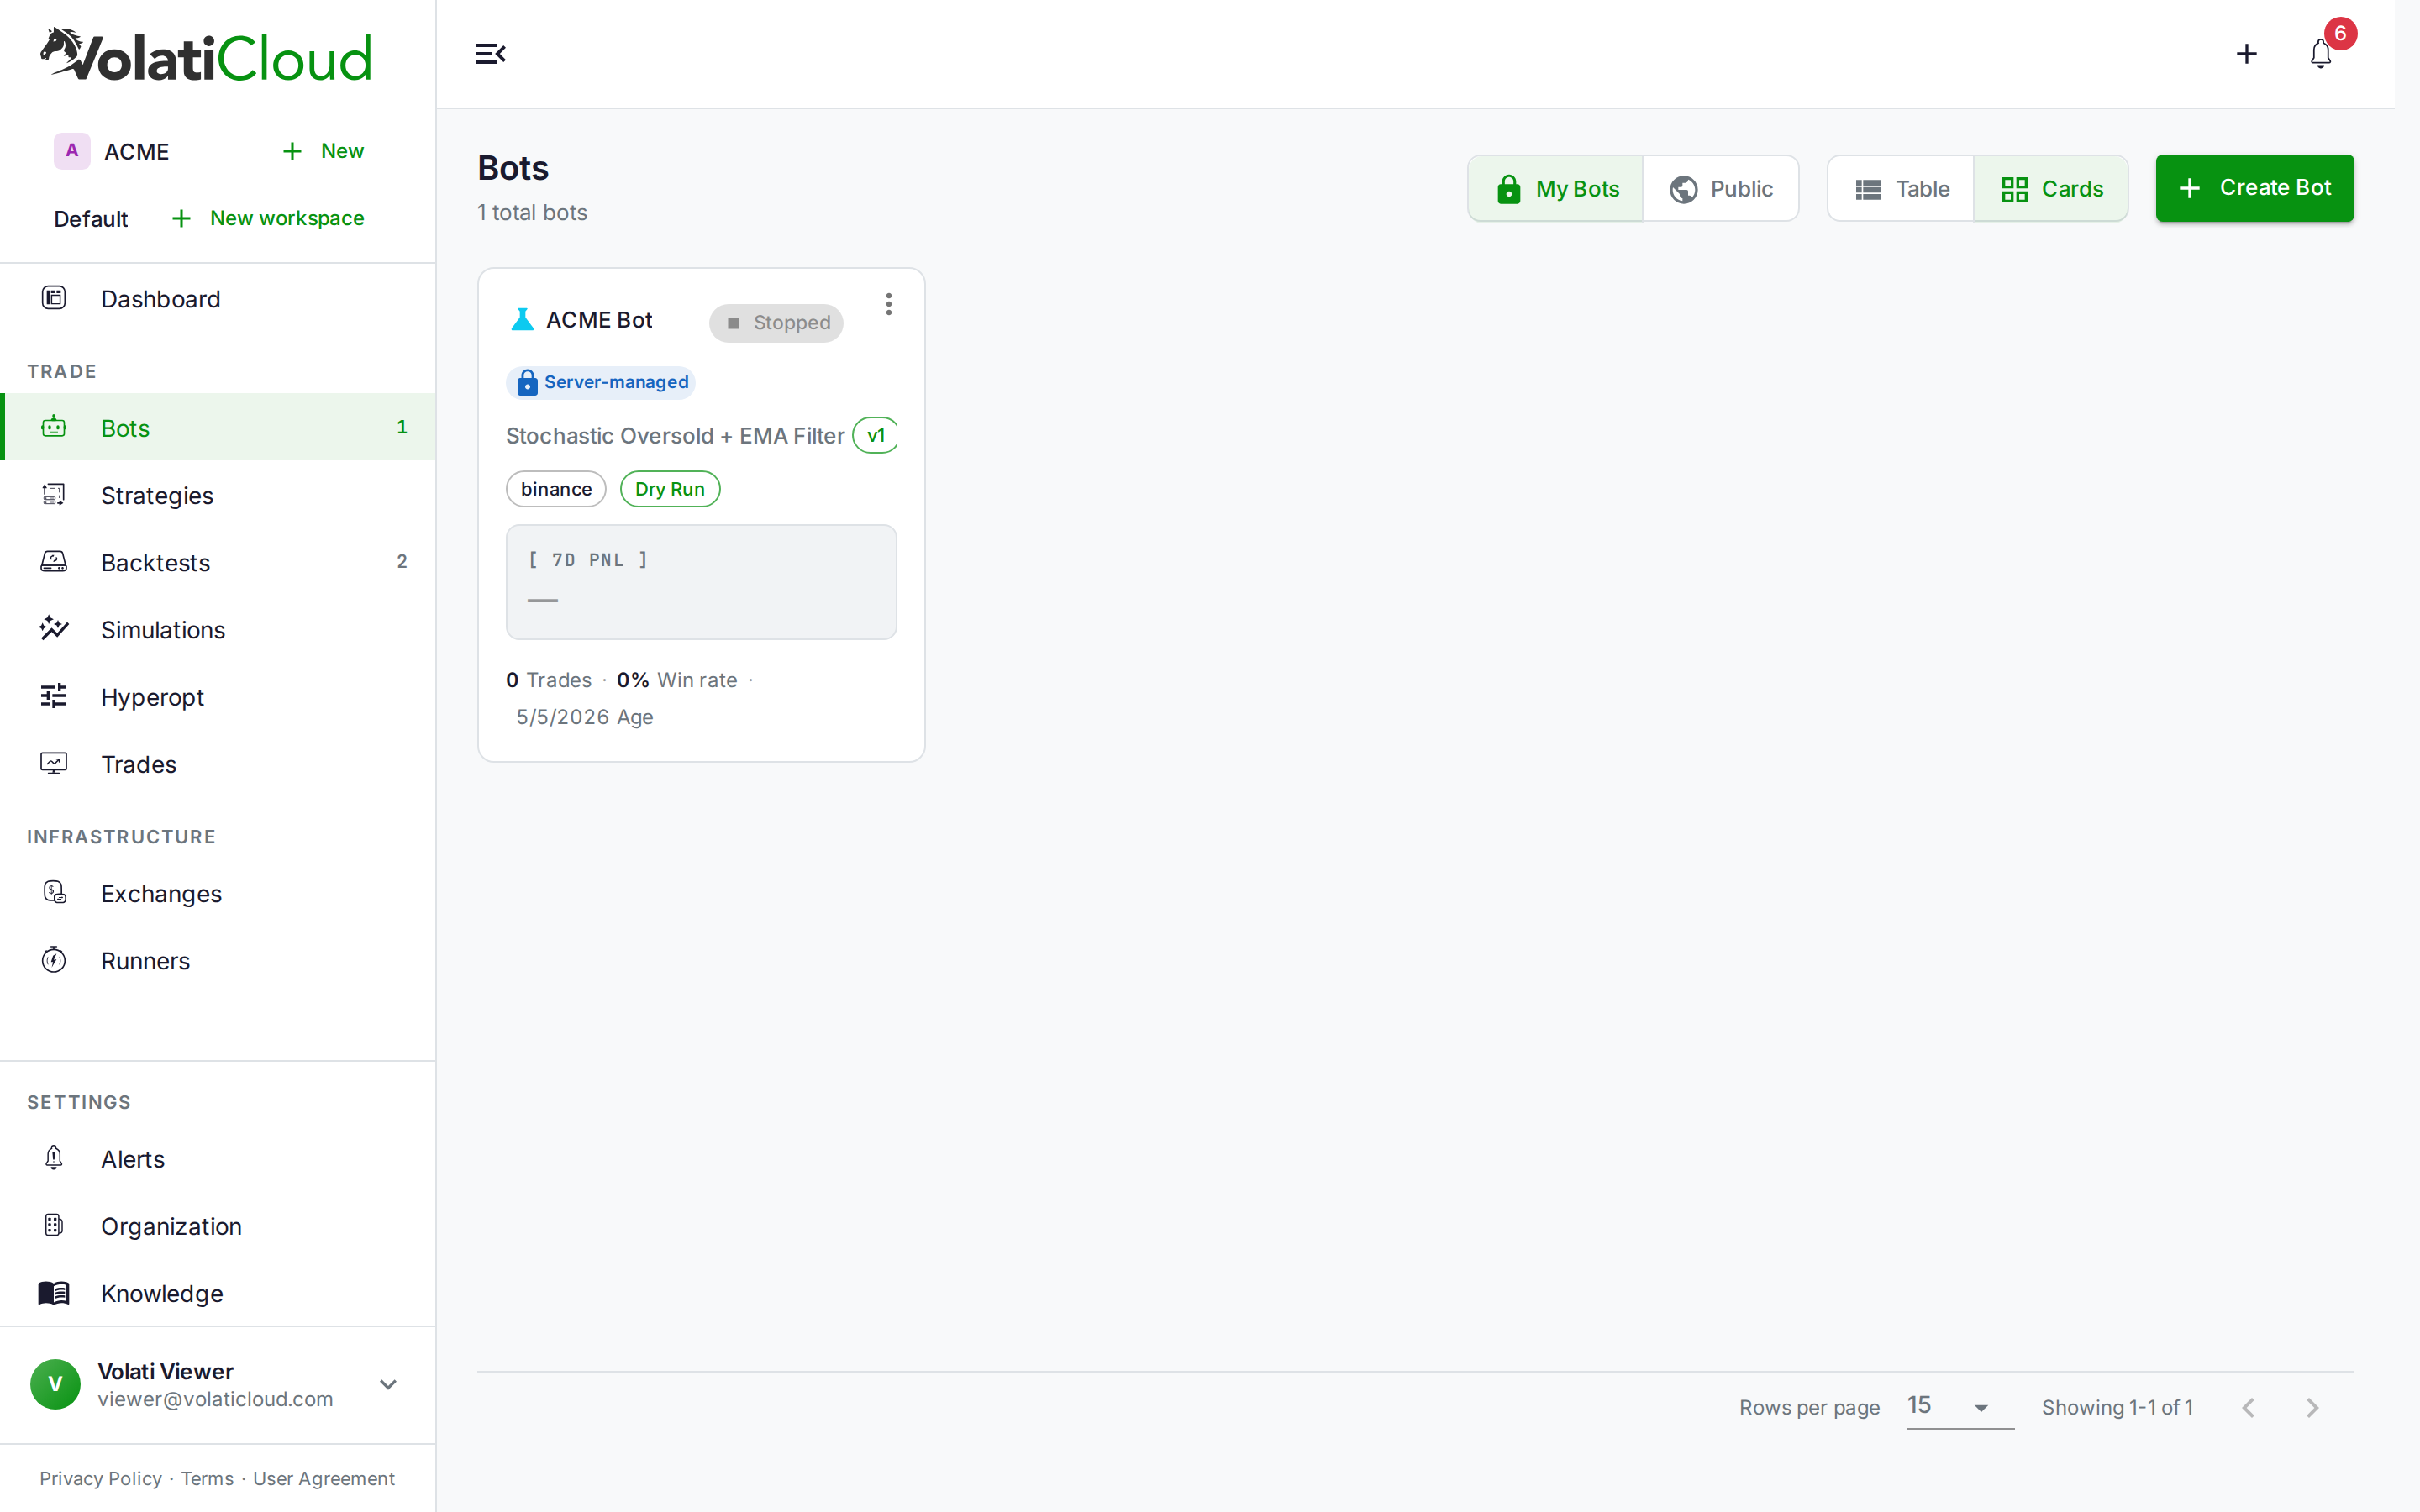
Two views do most of the journaling work for you:
- All-time and 7-day P&L on each bot card. The 7-day PnL block is specifically useful for journaling because it gives you a rolling recent-performance number to log weekly, rather than forcing you to compute it yourself from a raw trade list.
- The closed-trade history, which already has the entry price, exit price, and duration recorded — the exact fields a manual journal asks you to type by hand.
Your job at this layer isn't to record the data — it's to add the one thing the platform can't infer: why a given trade or week looks the way it does. "Three losing trades in a row on ETH/USDT, all during the CPI print volatility spike" is a journal entry a spreadsheet of numbers alone can't produce. The trade data tells you what happened; you have to write down what you think caused it.
If you're running the strategy across multiple pairs or exchanges, keep the trade-history export handy — see automatic bot database backup for how VolatiCloud preserves that history even after a bot is deleted or recreated, so a strategy's full track record survives configuration changes.
The Weekly Review: Comparing Live Behavior to the Backtest Hypothesis
This is the step most journals skip entirely, and it's the one that actually produces insight. Once a week, put the live numbers next to the backtest numbers from step one:
| Metric | Backtest (expected) | Live (last 7-30 days) | Verdict |
|---|---|---|---|
| Win rate | 58% | 51% | Within normal variance for the sample size |
| Avg. trade duration | 6h | 4h | Faster exits — check for a stoploss or fee difference |
| Max drawdown | 12% | 8% | Inside the historical range, no action needed |
| 7-day P&L | — | -1.4% | One red week; not yet a pattern |
The goal isn't to demand a perfect match — live trading never matches a backtest exactly, because of fees, slippage, and execution timing the backtest can only approximate. How exchange fees silently affect P&L and backtesting fees and slippage both cover why a small, consistent gap between backtest and live numbers is expected rather than alarming.
What you're watching for is a structural divergence — a metric that's not just off by a little, but trending in one direction week over week. A win rate that's 7 points below backtest for one week is noise. A win rate that's been declining for four consecutive weekly reviews is a strategy that may be drifting out of the market regime it was built for. How to read a backtest walks through which metrics are the most reliable signal versus which ones are noisy by nature — useful context before you decide a divergence is real.
A Journal Template You Can Copy
Here's a minimal weekly template that takes under five minutes to fill in, because most of the fields are copy-pasted from the dashboard rather than composed from scratch:
## Week of [date] — [Strategy name] on [Bot name]

**Hypothesis reminder:** [one sentence, copied from the original entry]

**This week's numbers:**
- 7-day P&L: [from bot card]
- Trades closed: [count]
- Win rate this week: [wins / total]
- Notable trades: [any outlier win or loss, with the pair and rough cause]

**Compared to backtest baseline:**
- Win rate: [live] vs [backtest] — [in range / diverging]
- Drawdown: [live] vs [backtest max] — [in range / diverging]

**Market context:** [what was BTC/the broader market doing this week —
trending, ranging, high or low volatility]

**Action:** [none / adjust parameters / pause / fork and test a variant]
Keep entries short. A five-minute weekly habit survives; a thirty-minute one doesn't. The value compounds — after eight or ten weeks, you have a record that shows not just what the bot did, but what kind of market conditions correlate with its best and worst weeks, which is exactly the input you need for the next hypothesis.
When the Journal Tells You to Fork, Pause, or Kill a Strategy
The weekly review exists to answer one question: is this still the strategy I backtested, or has something changed? Three outcomes follow from that:
Keep running, no change. Live metrics track the backtest baseline within normal variance. This is the most common and least interesting outcome — no journal entry should require action most weeks.
Fork and test a variant. If the journal shows a consistent, explainable divergence — say, the strategy underperforms specifically during low-volume weekend sessions — that's a hypothesis for a new variant, not a reason to abandon the original. Strategy versioning and forking keeps the original bot running unchanged while you backtest the adjustment separately.
Pause and investigate. If drawdown exceeds the backtested maximum, or a losing streak has run longer than anything in the backtest's trade history, that's the threshold for pulling the bot out of live trading until you understand why — not for tweaking parameters on the fly, which risks curve-fitting to the very market conditions you're trying to survive.
The journal is what turns "the bot had a bad month" from an emotional reaction into a decision with evidence behind it.
Start This Week
You don't need a new tool to start this journal — you need five minutes and the dashboard you already have open. Pull up your bots page, note this week's 7-day P&L for each bot, and write one sentence about what the market did. Do that once a week for two months and you'll have a record most manual traders never build: a direct comparison between what you expected a strategy to do and what it actually did, with the data to tell the difference between noise and a real problem.