New Dashboard: Portfolio Overview, Bot Health & Live Activity Feed

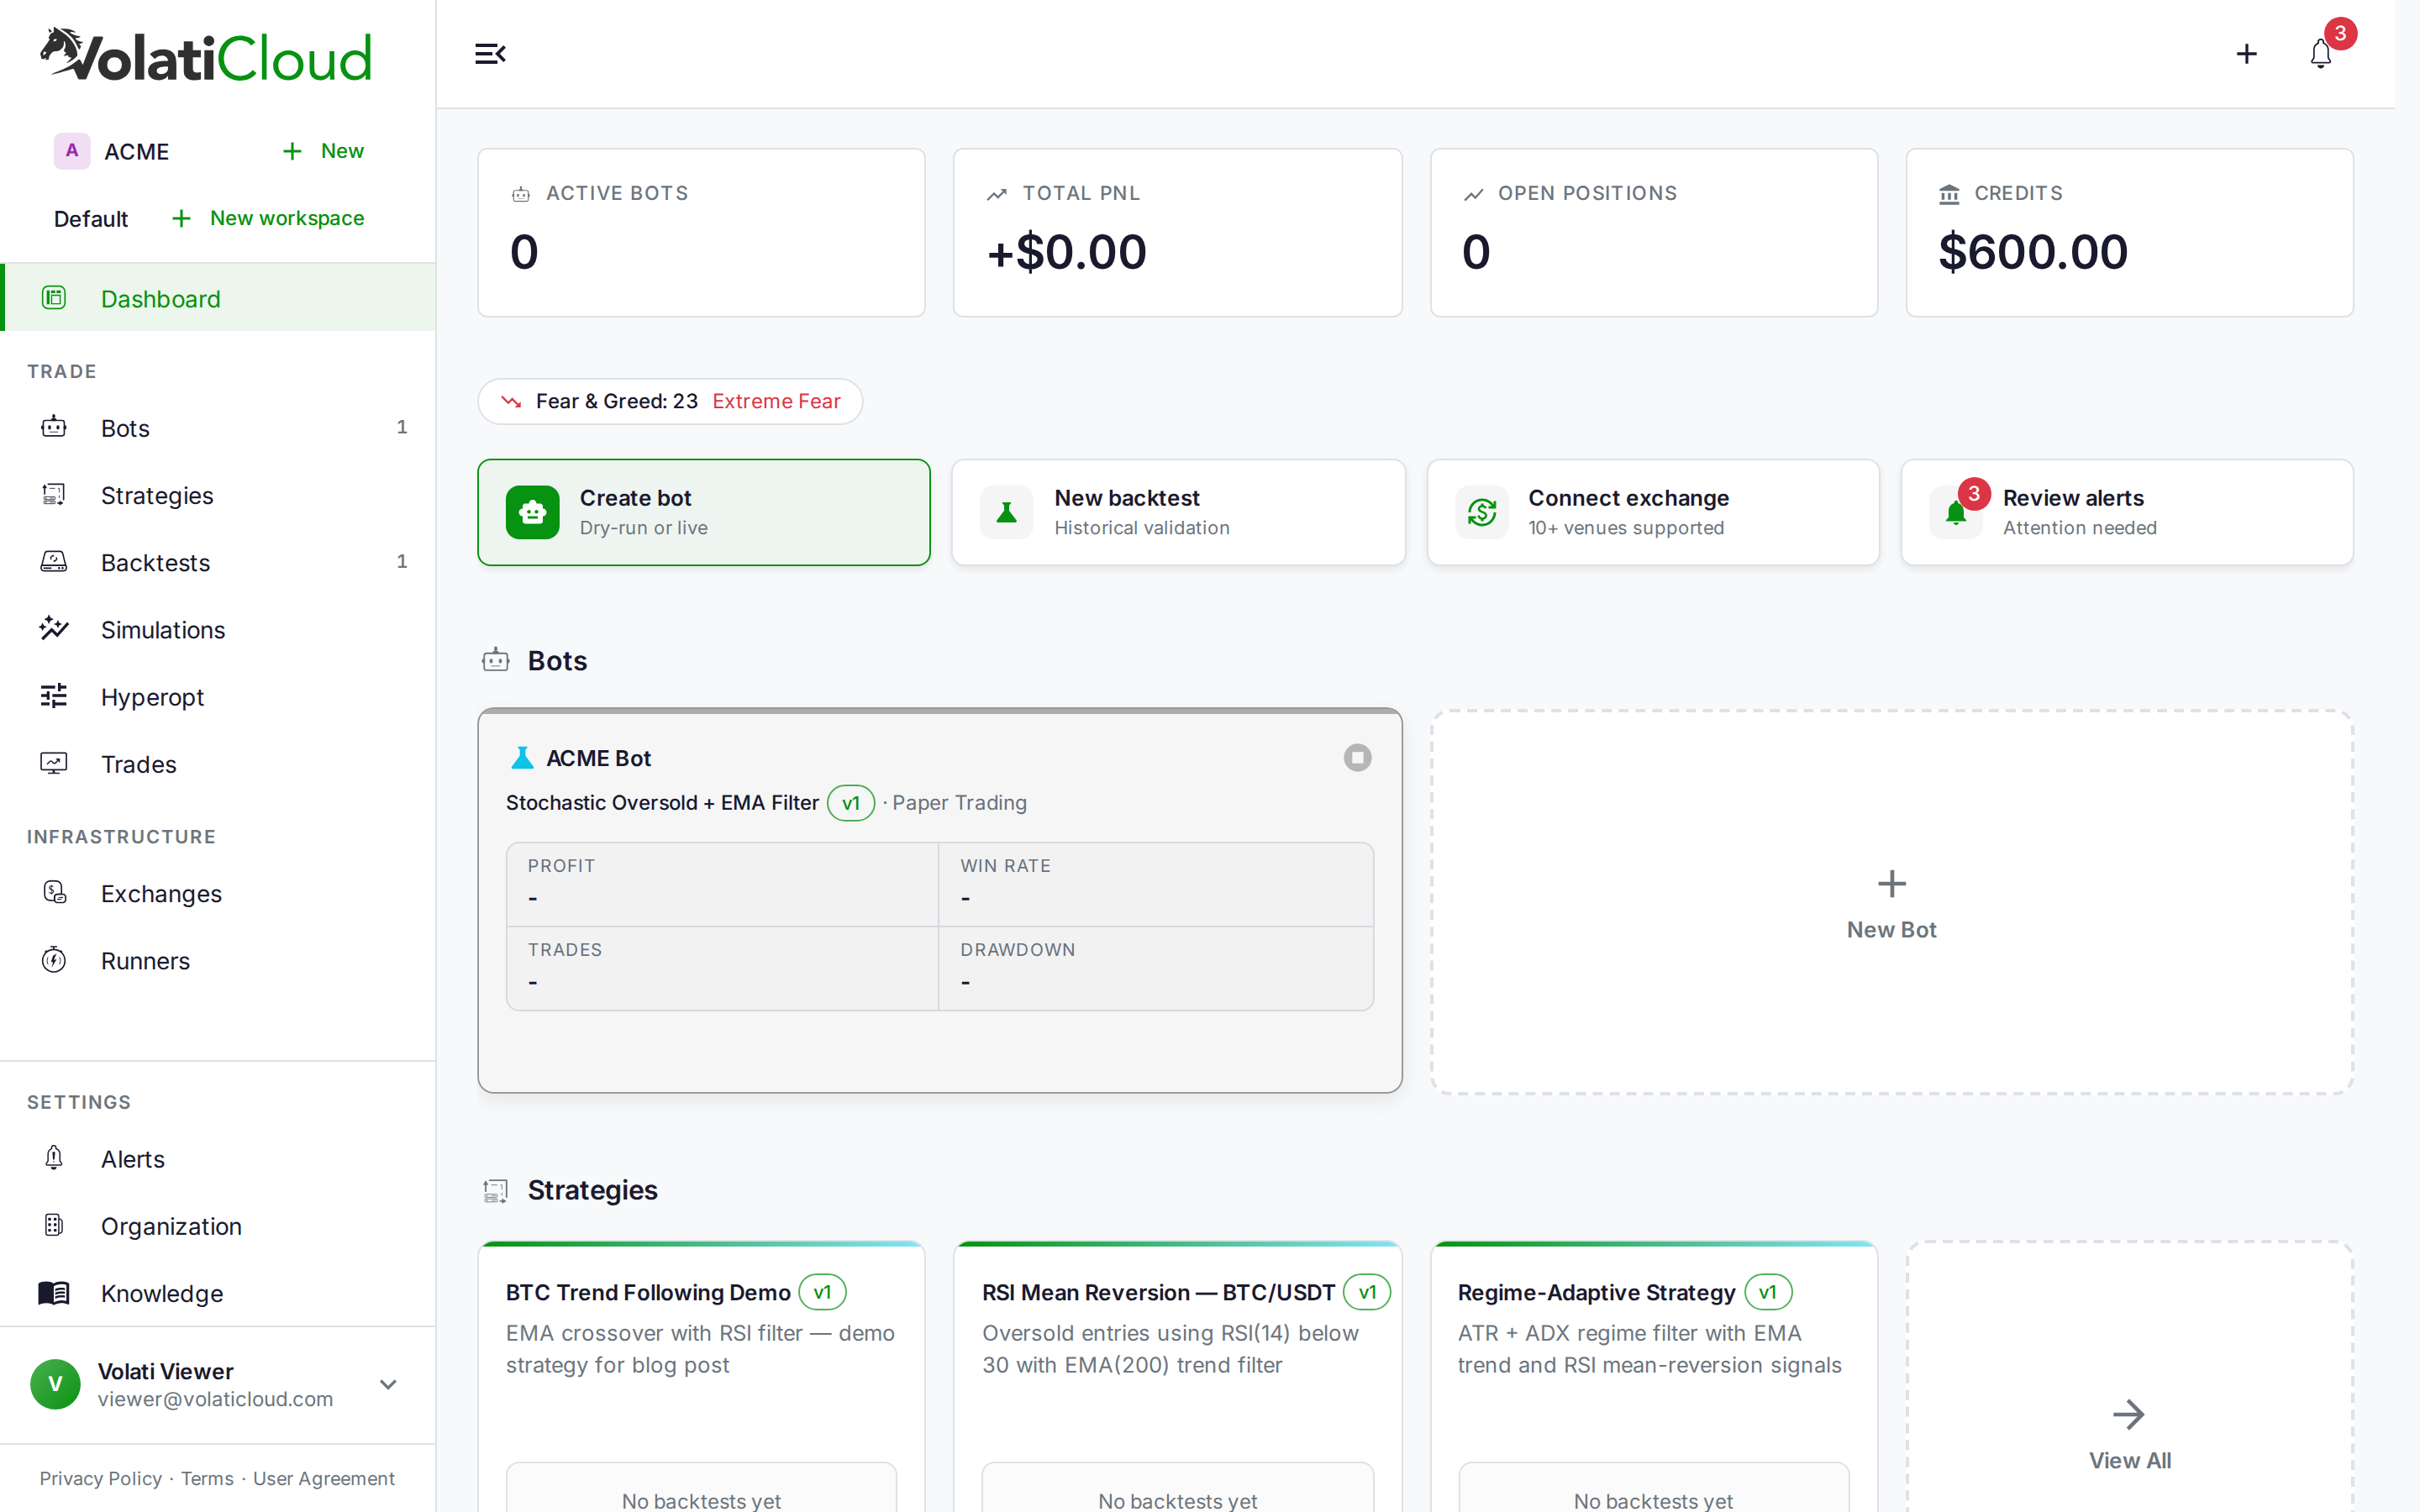
The VolatiCloud dashboard has been rebuilt from the ground up. Instead of a sparse landing page, you now get a complete operational picture the moment you log in: open portfolio P&L, a live health summary of every running bot, and a scrollable feed of recent trade activity — all without navigating away from the home screen.
What Changed and Why
The old dashboard was effectively a blank screen with a navigation sidebar. Users had to open the Bots list, then drill into each bot individually to understand whether their portfolio was up or down, whether any bots had errors, and what had traded recently. For traders running more than two or three bots, this was a lot of manual clicking to answer a simple question: is everything working?
The redesign introduces a decision-ready grid — a layout designed so that every important signal is visible at once, arranged in priority order: portfolio health first, individual bot status second, recent activity third.
Portfolio Overview Panel
The top section of the dashboard now shows aggregated portfolio metrics across all your bots:
- Total portfolio value — the sum of all open position values at current market prices
- Unrealized P&L — combined gain or loss on all active positions, shown in both absolute and percentage terms
- Win rate — rolling percentage of closed trades that closed in profit, across all bots
- Active trades — count of currently open positions
These numbers update in real time through GraphQL subscriptions, so the figure you see reflects actual market prices, not a stale snapshot from your last manual refresh.
This is the same data that was always available in per-bot detail views — it's now aggregated and surfaced one level higher so you can read portfolio state in a glance.
Active Bots Health Grid
Below the portfolio panel, the dashboard renders a health card for each running bot. Each card shows the bot's name, exchange, trading pair, current status (running, stopped, error), and the most recent trade timestamp with a freshness indicator.
The freshness label is new behavior shipped alongside the dashboard. It shows how long ago the last event occurred — "2m ago", "47m ago" — and turns amber when a bot hasn't traded or sent a heartbeat within an expected window. This surfaces bots that are technically running but have gone quiet, which often indicates a connectivity issue, an empty order book, or a strategy waiting on conditions that haven't triggered in a while.
Status chips are color-coded:
| Status | Color | Meaning |
|---|---|---|
| Running | Green | Bot is active and processing signals |
| Stopped | Grey | Bot was manually stopped, no error |
| Error | Red | Bot encountered a fatal error and halted |
| Stale | Amber | Running but no recent activity |
This means a quick glance at the bot grid tells you whether any bot needs attention — without opening the Bots list.
Real-Time Activity Feed
The right column (or bottom section on narrower viewports) shows a chronological feed of recent events across all bots:
- Trade entries and exits with pair, side (long/short), and profit on close
- Bot start and stop events
- Error events with a short reason string
- Backtest and hyperopt completions
The feed is paginated but loads new events automatically as they arrive, so if a trade executes while you're watching the dashboard, it appears without a manual refresh. This is built on the same WebSocket subscription infrastructure that powers the per-bot monitoring view — the dashboard is simply subscribing to aggregated events from all bots rather than a single one.
The Getting-Started Checklist
For new accounts, the dashboard shows a Getting Started checklist before the portfolio panels. The checklist guides users through the five steps needed to run a first bot: connect an exchange, create a strategy, set up a runner, create a bot, and start it. Once all five are complete — or if you explicitly dismiss it — the checklist gives way to the portfolio view.
This means the dashboard adapts to where you are in setup. An account with no bots configured sees onboarding guidance. An account with active bots sees operational metrics.
Accessibility and Keyboard Navigation
The redesign includes full keyboard navigation across all dashboard panels. Every interactive element — bot health cards, activity feed entries, portfolio detail links — is reachable by Tab and activated by Enter or Space. Focus indicators meet WCAG 2.1 AA contrast requirements, and animations respect the prefers-reduced-motion media query, which disables the live-update transitions for users who have that system preference set.
A 30-Second Morning Check
The layout is ordered so you can triage your whole operation in one screen, top to bottom:
- Portfolio panel — is total unrealized P&L roughly where you expect, and is the active-trades count sane? A sudden jump in open positions can mean a strategy is over-firing.
- Bot health grid — scan for any red (error) or amber (stale) chips. Green-and-fresh across the board means nothing needs you; a stale bot that should be trading is your first click.
- Activity feed — skim the last few events. A run of error entries, or a long gap with no trades during active market hours, is worth a closer look.
If all three read clean, you're done — no drill-down required. That's the point of the redesign: the dashboard answers "is everything working?" before you've finished your coffee, and only asks for your attention when something actually needs it.
How VolatiCloud Delivers This
The portfolio and activity aggregates are computed by dedicated GraphQL query types — dashboardPortfolio and dashboardActivity — that aggregate across all bots in your organization in a single round-trip. This is more efficient than the previous approach of fetching each bot's data separately and stitching it together client-side.
The per-entity status calculation (EntityStatus) runs server-side, which means the color and freshness state you see in the dashboard is consistent with what you'd see if you navigated directly to a bot's detail page. There's a single source of truth for status rather than separate logic in each view.
For teams using VolatiCloud with multiple members, the dashboard shows data scoped to your organization — everyone on the team sees the same portfolio numbers and the same activity feed, which makes it useful as a shared "ops screen" for teams running bots together.
What's Next
The dashboard now has the data infrastructure in place to extend. Upcoming work includes per-strategy performance breakdown in the portfolio panel, a notification badge for error events that persists until acknowledged, and a configurable refresh cadence for users on slower connections.
To see the new dashboard, log in at console.volaticloud.com. If you're new to VolatiCloud, the quick-start guide walks through connecting your first exchange and launching a bot in under ten minutes. For more on monitoring individual bots, see the bot monitoring documentation or the post on real-time WebSocket trade events.
If you're running multiple bots and want to think about how to organize them across strategies, multi-bot portfolio orchestration covers the structural decisions — which pairs, which strategies, how to avoid overlap — that the new dashboard is designed to help you track.