From Manual Trading to Automated: A Practical Transition Guide

Every discretionary trader hits the same wall: you identify a clear setup, but you're away from your desk. Or you enter five minutes late because you hesitated. Or you close a winning trade early because watching a number tick down triggers a reaction no amount of discipline fully overrides. Automating a strategy doesn't make you a better trader — it makes the bot execute your strategy exactly as written, without the hesitation, without the regret, every single candle.
The transition from "I trade by hand" to "my bot trades for me" has real friction, though, and most guides skip the hard part: figuring out what you actually want to automate. This guide walks you through the full process — from translating your discretionary habits into precise rules, to encoding those rules in VolatiCloud, to validating them in backtests and paper mode before putting real capital at risk.
The Mental Model Shift
Manual trading is a conversation with the market — you read conditions, you apply judgment, you act. Algorithmic trading is a commitment: you write down every condition, every threshold, every exit rule in advance, and then you let go of the in-the-moment judgment call.
That commitment is the hardest part of the transition. When traders try to write down their strategy, they often discover their "method" is a cluster of loosely related intuitions. "I buy when it looks oversold" is not a rule. "I buy when RSI(14) crosses below 30 and the close is above EMA(200)" is a rule.
The first step in going automated is self-interrogation, not software:
- What conditions trigger a buy? List every factor. Be specific about indicator parameters and thresholds.
- What conditions trigger a sell? Profit target? Stop-loss percentage? Indicator reversal? Time limit?
- What conditions keep you out? Trend filter? Volatility threshold? Session time?
- What size do you trade? Fixed stake? Percentage of equity? Does it scale with volatility?
If you can answer all four with exact numbers, you're ready to build. If you can't, automating isn't your next step — clarity is.
Step 1: Convert Rules to Conditional Statements
Take each answer from the self-interrogation and tighten it into a conditional statement a computer can evaluate:
| Informal rule | Precise version |
|---|---|
| "Buy on RSI oversold" | RSI(14) < 30 on the 1h chart |
| "With the trend" | Close > EMA(200) |
| "Set a tight stop" | Stop-loss at 2% below entry |
| "Don't trade sideways markets" | ATR(14) > 0.8% of price |
| "Take profits in thirds" | ROI targets at 2%, 4%, 6% |
Each row becomes either a condition node or a configuration parameter in your bot. This table is your specification — write it before touching any UI. If a row can't be made precise, that part of your strategy isn't automatable yet.
A common realization at this stage: many discretionary "rules" are actually discretionary pattern recognition that resists reduction to indicators. If "it looks oversold" means something different each time, that rule won't survive encoding. Either find the indicator that approximates your judgment or accept that this particular edge belongs to the manual side of your trading.
Step 2: Encode the Strategy in VolatiCloud's Strategy Builder
VolatiCloud's Strategy Builder is designed for exactly this encoding process. You drag indicator nodes onto an entry/exit canvas, connect them with AND/OR logic gates, and configure every parameter numerically — no Python required.
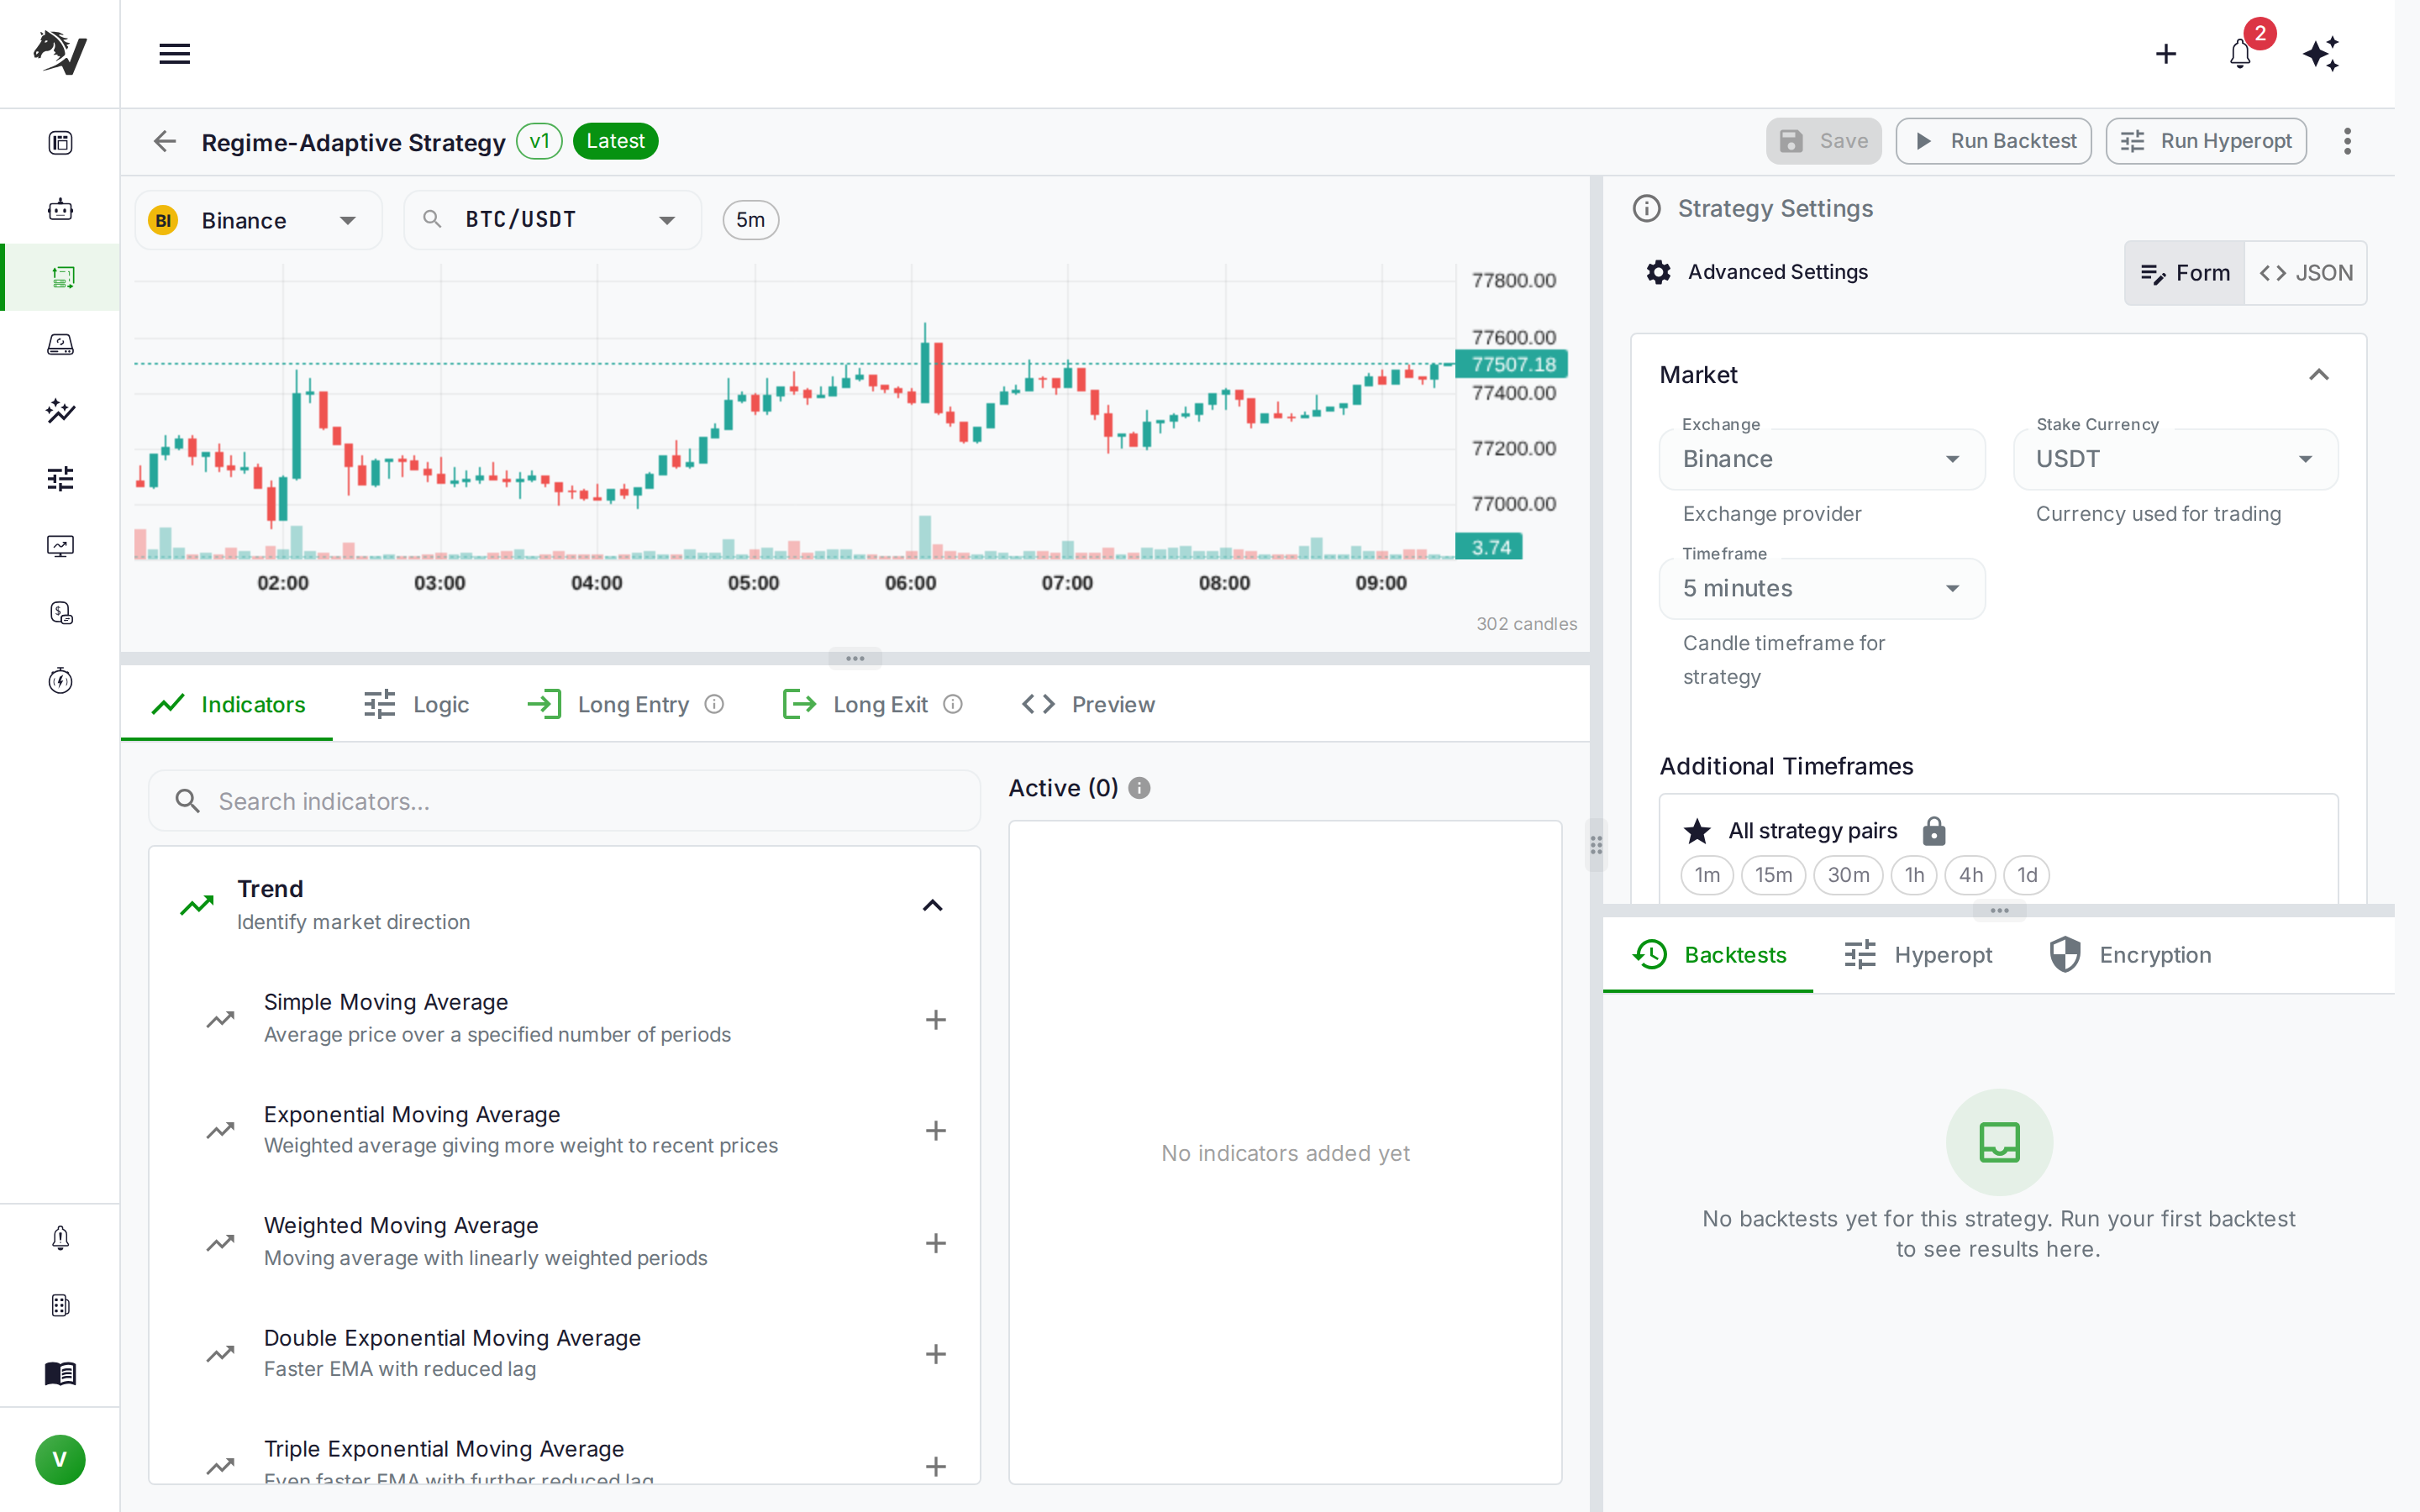
From the Strategies page, click New Strategy, give it a descriptive name that matches your written spec, and open the Studio. The Indicators tab is where you add every indicator your rules reference:
- Search the library (RSI, SMA, EMA, MACD, ATR, Bollinger Bands, Stochastic, and more)
- Click an indicator to add it to your canvas
- Set the period and any other parameters to match your specification exactly
Resist the temptation to tweak parameters at this stage. Encode what your spec says, then validate it — adjustments come after testing, not before.
After adding indicators, switch to the Long Entry and Long Exit tabs. These are where you wire indicator values into conditions using the logic tree. The entry condition from the example above — "RSI(14) < 30 AND close > EMA(200)" — maps to two COMPARE nodes joined by an AND root node.
The Logic tab handles position mode (long-only, short-only, or both via mirror mode), leverage for futures, and advanced callbacks like custom stoploss functions for trailing stop implementations.
Finally, the Preview tab renders the generated Python/Freqtrade code. This is the actual strategy your bot will run. Check it: does the generated class match your mental model? If the conditions look wrong, fix them in the visual tree — the code is derived, not editable directly.
If you're migrating from a manually-coded Freqtrade strategy, use Code Mode instead of the visual builder. Paste your existing Python directly, and VolatiCloud versions and deploys it alongside builder-created strategies. You can switch between modes per strategy. See Strategy Code Mode for details.
Step 3: Backtest Before You Trust
A strategy that looks right on paper frequently has properties you didn't anticipate: it overtrades in ranging markets, it has a hidden three-month losing streak inside a profitable three-year run, or its headline return comes from six trades that won't repeat.
Backtesting finds these properties before real money does.
From the Strategy Studio toolbar, click Run Backtest. Configure:
- Date range: Use at least 12 months, spanning multiple market conditions. If your rules are tuned on the last 6 months of data, test on data the rules have never seen.
- Trading pair(s): Test the specific pairs you intend to trade. A strategy profitable on BTC/USDT may lose on altcoins with wider spreads.
- Timeframe: Match the chart your indicators are parameterized for.
- Stake amount: Match your planned live configuration to get realistic position-level metrics.
When the backtest completes, focus here before looking at profit factor:
- Max drawdown: The largest peak-to-trough loss. Ask honestly: would I have held through this without touching the stop?
- Consecutive losing trades: The worst losing streak tells you the psychological cost of running this live.
- Trade count: Too few trades means the result isn't statistically meaningful. Fewer than 50 trades is unreliable territory.
- Win rate and average R/R: A 40% win rate is fine if your average winner is 2.5x your average loser.
A good backtest result is a necessary condition for deploying a bot. It is not sufficient. For a full guide to interpreting backtest metrics and avoiding the common traps, see Backtesting Deep Dive. For how to avoid over-fitting your parameters to historical data, see Avoiding Overfitting in Backtests.
Step 4: Paper Trade to Validate Execution
Backtests use historical candles and assume fills at close prices. Live execution is messier: spreads widen at volatility spikes, candles close milliseconds apart, and API latency exists. Paper trading bridges this gap — your bot runs against live market data without sending real orders.
In VolatiCloud, create a Bot from the Bots page: select your strategy, your exchange connection, a runner (cloud or self-hosted), and set trading mode to Paper. The bot evaluates your entry and exit conditions on every candle close, tracks open positions and P&L, and streams all of this to the monitoring dashboard — exactly like a live bot, but with zero real executions.
Run paper mode for at least 2–4 weeks, long enough to see several complete trade cycles. During this period, watch for:
- Fill quality: Does paper P&L roughly track your backtest expectations for the same period?
- Unexpected behavior: Does the bot enter or exit in situations you didn't anticipate? If so, find the discrepancy in your condition tree.
- Connectivity: Does your exchange connection stay stable across the full paper period?
If paper trading exposes a systematic problem — the bot never triggers, or it triggers constantly, or fills are consistently far from expected — investigate the root cause before going live. From Paper Trading to Live has the full pre-live checklist.
Step 5: Deploy a Live Bot
When paper trading validates your strategy, going live is a one-field change: update the Bot's trading mode from Paper to Live, confirm the stake amount, and start it.
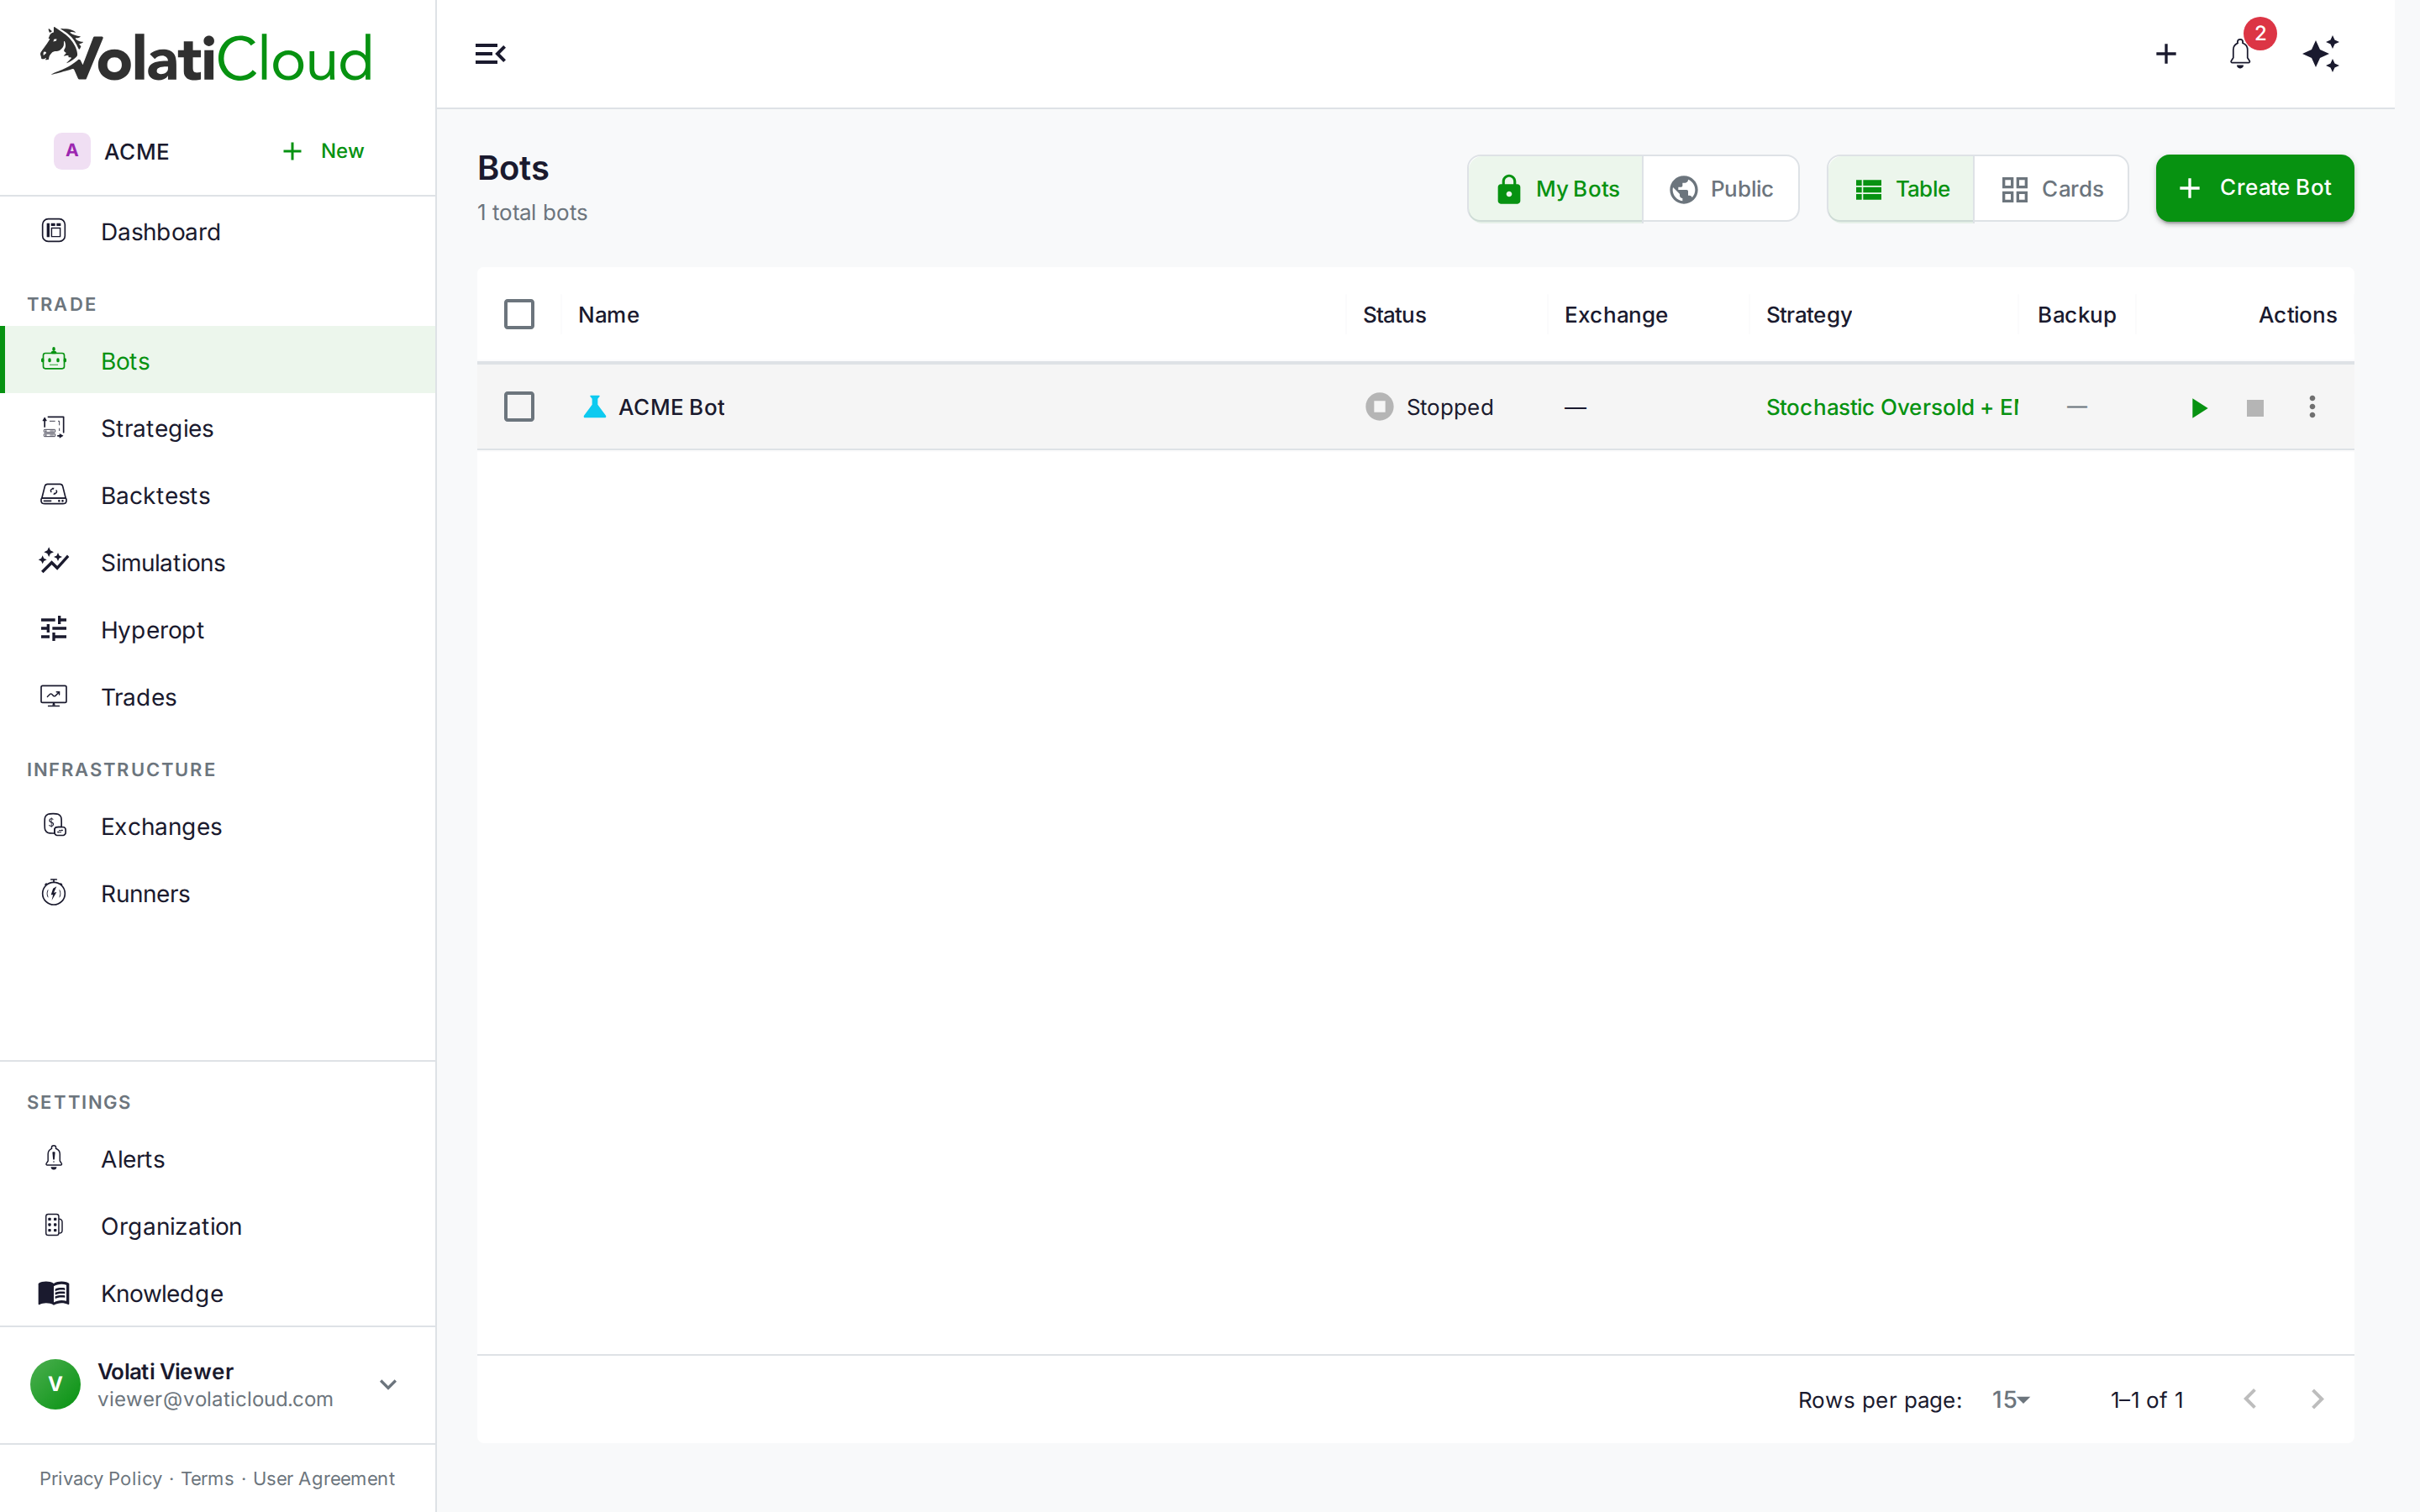
VolatiCloud handles the infrastructure side: the bot runs on its assigned Bot Runner (a persistent Docker or Kubernetes process), connects to your exchange through encrypted API credentials, and streams live trade events — entries, exits, equity curve updates — to the dashboard in real time.
You can configure Alerts to notify you on Telegram or email when the bot opens or closes a position, when it hits a drawdown threshold, or when it encounters a connection error. This keeps you informed without requiring you to watch charts.
One adjustment most traders need after going live: resist the urge to interfere. The bot executes the rules you wrote and validated. If you override it because you have a gut feeling, you've turned an automated strategy into a partially manual one — and you've corrupted the execution record you need to evaluate the strategy's actual performance.
Common Mistakes in the Transition
Encoding before specifying. Opening the Strategy Builder before writing a precise specification leads to decisions made by UI rather than logic. The builder makes anything easy to add; only your spec tells you what should be there.
Tuning parameters to maximize backtest profit. Fitting RSI(7) instead of RSI(14) because 7 produced a higher backtest Sharpe ratio is a path to disappointment live. Fit parameters to logic (standard values exist for good reasons), then validate on data the tuning process never saw. See Walk-Forward Optimization for a rigorous approach.
Skipping paper trading. Two weeks of paper trading is cheap. Discovering a bug in live execution is not.
Starting with too much stake. Your first live month should run with an amount you can afford to lose entirely. The goal is validating the system — exchange connectivity, fill quality, monitoring setup — not generating returns.
Confusing "worked in backtest" with "will work live." Market regimes change. A strategy that produced strong results over three years of historical data can underperform for six months when market structure shifts. Review live performance monthly against your backtest baseline and have a defined threshold for when you pause the bot.
Not setting drawdown guards. VolatiCloud lets you configure maximum drawdown limits at the bot level. Use them. If the bot hits a 15% drawdown when you expected 8%, something changed — either the market or your assumptions. A drawdown guard stops execution and gives you time to investigate instead of letting a bad run compound.
The Complete Workflow
The path from manual trader to algo bot operator looks like this:
Write specification
    ↓
Encode in Strategy Builder
    ↓
Backtest on ≥12 months of data
    ↓
Walk-forward validate parameters
    ↓
Paper trade for 2–4 weeks
    ↓
Deploy live bot with drawdown guards
    ↓
Review monthly against baseline
Every shortcut in this sequence costs you either money or understanding. The sequence is not longer than it needs to be.
VolatiCloud covers every step: the visual Strategy Builder for encoding rules without code, backtesting for historical validation, Monte Carlo simulation for stress-testing your trade sequence across thousands of permutations, paper mode for live execution validation, and a real-time monitoring dashboard that keeps you informed without demanding your constant attention.
The first bot is the hardest. After you've gone through the full cycle once — specification, backtest, paper, live — the process becomes repeatable. Your second strategy takes half the time. Your third is mostly muscle memory.
Build your first strategy on VolatiCloud — the visual builder means you can go from a written specification to backtest results in under an hour. If you want to see the Strategy Builder in action before starting, the Strategy Builder Walkthrough shows a complete three-indicator strategy being built from scratch.