Crypto Market Regime Detection: Build Bots That Adapt to Every Market Condition

Most trading strategies are designed for one market condition — and quietly bleed when the market changes. An EMA crossover bot that performed well during a strong bull trend will churn through fees in a sideways consolidation. An RSI mean-reversion bot that thrives in ranging markets will get steamrolled by a breakout. Market regime detection is the filter that sits above your entry logic and tells your bot which condition the market is actually in.
What Is a Market Regime?
A market regime is a persistent statistical property of price action: the direction it's trending, how strongly it's trending, and how volatile it is. Most crypto markets cycle through three distinct regimes:
| Regime | Characteristics | Best Strategy Type |
|---|---|---|
| Trending (up or down) | Sustained directional movement, higher highs or lower lows | Trend-following (EMA crossovers, momentum) |
| Ranging | Price oscillates within a band, no clear direction | Mean-reversion (RSI, Bollinger Bands) |
| High Volatility / Crisis | Large, fast moves in either direction, regime unclear | Reduce exposure, tighten stoploss, or stay flat |
The problem isn't that trend-following or mean-reversion strategies are bad — it's that each one only works in its own regime. A strategy without regime awareness is essentially making a permanent bet that the market will stay in one state forever.
The Three-Indicator Regime Filter
No single indicator reliably classifies market regime. A three-layer approach gives you a more robust signal:
Layer 1: ATR for Volatility State
Average True Range (ATR) measures how much price moves per candle, normalized over a lookback period. A rising ATR signals expanding volatility; a falling ATR signals compression. Comparing the current ATR to its own 50-period moving average gives you a volatility state:
ATR > ATR_MA × 1.5→ high-volatility regime (be cautious or stay flat)ATR < ATR_MA × 0.8→ low-volatility / compression regime (often precedes breakout)- Otherwise → normal volatility (trend/range detection matters more)
ATR is already a core indicator in VolatiCloud's Strategy Builder — the same ATR you'd use for dynamic stop-loss sizing works equally well as a regime volatility filter.
Layer 2: Slope of a Long-Period EMA for Trend Direction
A 200-period EMA is the canonical trend filter in institutional trading. But the price relative to the EMA only tells you direction, not strength. What you want is the slope — how fast the EMA is moving:
- Strong positive slope → uptrend regime
- Strong negative slope → downtrend regime
- Flat slope → ranging regime
You can proxy slope by comparing the current EMA value to its value N candles ago:
ema_slope = (ema_200 - ema_200.shift(10)) / ema_200.shift(10) * 100 # % change over 10 bars
A slope greater than +0.5% signals an uptrend; below -0.5% signals a downtrend; between those values signals a range.
If you would rather not compute a slope, the spread between two EMAs carries much the same information and is easier to express as a condition. Compare a fast EMA (20) against a slow one (100): a wide positive gap is an uptrend regime, a wide negative gap a downtrend, and two EMAs tangled together are the most reliable sideways signal there is. The size of the gap doubles as a confidence score — a large spread means the trend is well established, a near-zero spread means the pair is crossing back and forth.
Layer 3: ADX for Trend Strength
Average Directional Index (ADX) measures trend strength without indicating direction. It ranges from 0 to 100:
- ADX > 25: trending market (use trend-following rules)
- ADX < 20: ranging market (use mean-reversion rules)
- ADX between 20–25: ambiguous — wait for confirmation
ADX pairs naturally with the EMA slope. A strong EMA slope combined with ADX > 25 gives high confidence you're in a trend. A flat EMA with ADX < 20 confirms a ranging market.
Optional Layer 4: Bollinger Band Width for Compression
The three layers above tell you whether a trend exists and how volatile the market is. What they do not tell you is when a quiet market is coiling — and that is often the most tradeable moment of all.
Bollinger Band Width — the distance between the upper and lower bands as a percentage of the middle band — measures exactly that compression:
- Narrow width (below its own 20-period moving average): ranging, possibly coiling before a move
- Expanding width: a regime shift may be beginning
- Wide width: the trending move is already underway
A squeeze is a precursor to a breakout in either direction, so band width is a regime-timing signal rather than a directional one — pair it with the EMA relationship to get direction. VolatiCloud's BB indicator gives you the full band structure (upper, middle, lower) with configurable period and standard-deviation multiplier.
Building a Regime Filter in VolatiCloud's Strategy Builder
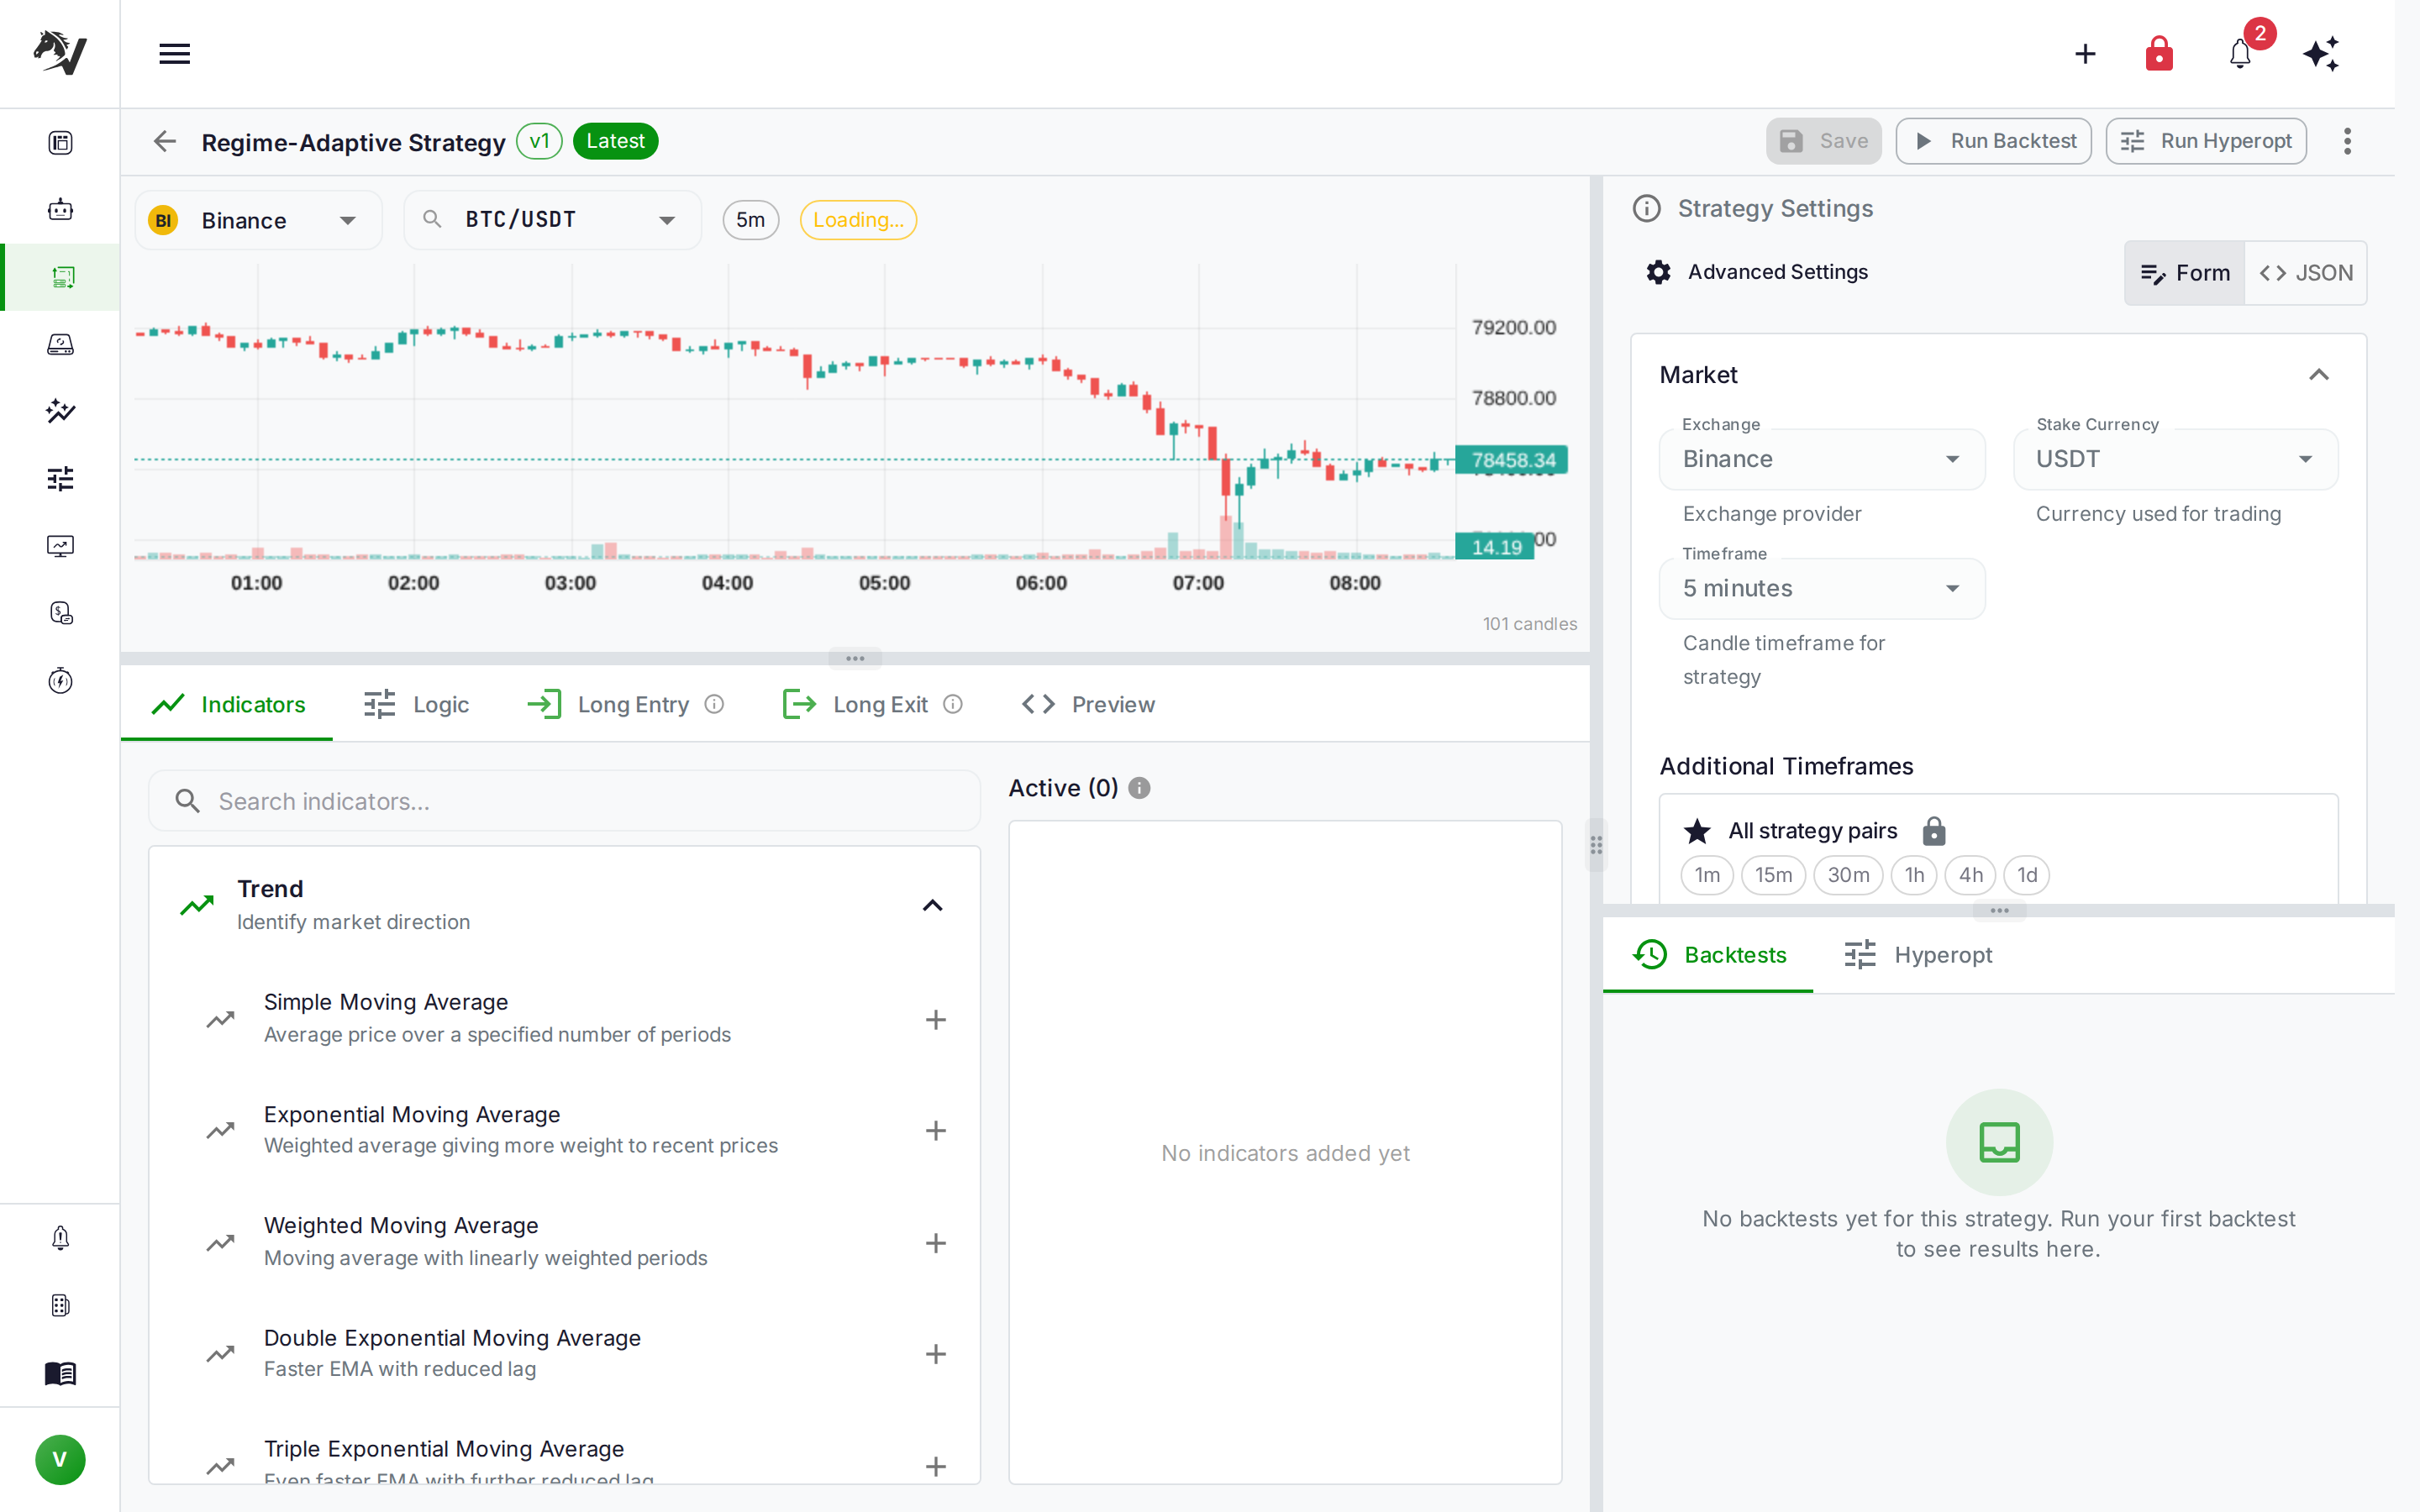
In VolatiCloud's Strategy Builder, you add regime detection indicators on the Indicators tab and then use their values in Logic tab conditions. Here's the full setup for a trend/range-aware strategy:
Step 1 — Add the regime indicators:
- Add ATR(14) — your volatility gauge
- Add EMA(200) — your long-term trend anchor
- Add ADX(14) — your trend strength meter
- Add EMA(20) and EMA(50) — your actual trade signal (for the trend regime)
- Add RSI(14) — your mean-reversion signal (for the ranging regime)
Step 2 — Define the regime conditions:
In the Logic tab, create condition nodes that check regime state before checking trade signals. The logic structure looks like:
Entry Long:
  AND
  ├── ADX > 25                           (confirm trending)
  ├── Price > EMA(200)                   (above long-term trend line)
  ├── EMA(20) crosses above EMA(50)      (trend signal fires)
  └── ATR < ATR threshold                (not in crisis volatility)
For the ranging regime, the mirror logic flips:
Entry Long (range mode):
  AND
  ├── ADX < 20                           (confirm ranging)
  ├── RSI(14) < 35                       (oversold)
  └── Price near lower Bollinger Band    (mean-reversion entry)
You don't need to build both modes into one strategy initially. A simpler first pass is to add a regime gate to your existing strategy — a condition that says "only trade if we're in the regime this strategy was designed for." This alone significantly reduces whipsaw losses.
Read the Strategy Builder documentation for the full breakdown of condition nodes, crossover operators, and how to chain AND/OR logic.
Backtesting Regime-Aware Strategies
Regime detection makes backtesting both more important and more demanding. A regime-aware strategy needs to be tested across all three regimes — not just the period where it was designed to work.
Minimum backtest coverage:
- 1 full bull trend (BTC 2020–2021, ETH 2023)
- 1 full bear trend (BTC 2022)
- 1 extended ranging period (BTC mid-2019, most altcoins post-2022)
- At least one high-volatility event (March 2020, May 2021, FTX collapse)
VolatiCloud's backtest configuration lets you set precise date ranges so you can test each regime separately and compare performance metrics side by side. Run one backtest on the bull period, one on the bear period, one on the ranging consolidation, and compare the results in the Analyzing Results view.
A regime-aware strategy should show:
- Positive returns in its target regime
- Minimal losses (ideally flat or slightly positive) in other regimes
- Reduced max drawdown compared to the baseline strategy
If your strategy produces large losses in non-target regimes, your regime filter isn't working — it's letting through trades it shouldn't.
Regime parameters (ATR threshold, ADX cutoff, slope sensitivity) are easy to overfit to a specific backtest period. Always validate with walk-forward optimization before deploying. The in-sample period should include multiple regime transitions, not just one.
The Common Pitfalls
Pitfall 1: Regime lag
ATR and ADX are lagging indicators. By the time ADX crosses 25 to signal a trend, you may have already missed the first 30–40% of the move. To compensate, set your regime entry threshold lower than the exit threshold — enter a trend regime at ADX > 20 but only exit it at ADX < 15. This hysteresis prevents constant flip-flopping around the boundary.
A second technique stacks with it: smooth the ADX itself. Add an SMA over the ADX output and reference the smoothed value in your condition, so a single noisy candle cannot flip the regime. Hysteresis handles the boundary; smoothing handles the noise.
Pitfall 2: Misclassifying breakouts
A volatility expansion (ATR spike) during a breakout looks like a "crisis" regime to a naive filter. In practice, it's the start of a trend. One mitigation: don't switch regime based on a single candle's ATR. Use a 3-candle confirmation — ATR must exceed the threshold for 3 consecutive candles before the regime changes.
Pitfall 3: Optimizing the filter, not the strategy
It's tempting to run hyperparameter optimization on the regime filter parameters — what ATR multiplier? What ADX cutoff? But this leads to regime-filter overfitting. Keep the regime parameters conservative and fixed (25/20 for ADX, 1.5× for ATR) and optimize only the trade logic parameters. The regime filter should be a general-purpose truth-teller, not a finely tuned curve-fit.
Pitfall 4: Forgetting transition periods
The most dangerous moment is when the market is switching regimes — when ADX is climbing from 18 to 22, or when a ranging market is about to break out. During these transitions, both trend and mean-reversion signals can fire simultaneously. One defensive approach: define a "no-trade zone" around regime boundaries, where neither signal triggers an entry.
Pitfall 5: Treating 25/20 as universal ADX thresholds
ADX > 25 and ADX < 20 are starting points, not laws. On 15-minute BTC charts ADX oscillates far faster than on daily charts, so a threshold that filters usefully on one timeframe is either permanently on or permanently off on another. Backtest the threshold on your timeframe and pair, and keep it only if it improves risk-adjusted performance rather than just trade count.
Pitfall 6: Reading Bollinger Band width in absolute units
Band width is (upper - lower) / middle × 100. Expressed as a raw distance it scales with the asset's price, so a "tight" number for BTC is meaningless for a $2 altcoin. Always compute band width as a percentage of the middle band and set every threshold in those terms — otherwise the same strategy silently changes behaviour the moment you point it at a different pair.
Pitfall 7: Using ADX without a direction filter
ADX measures strength, not direction. A market falling hard has a high ADX, and a trend-following long entry gated only on ADX > 25 will happily buy into it. Always pair the strength reading with a directional condition — price above/below the 200 EMA, or the EMA spread from Layer 2.
Combining Regime Detection with Monte Carlo Analysis
A regime-aware strategy usually shows better Sharpe ratios and lower maximum drawdown than a regime-blind strategy — but it also produces fewer trades, which means its backtest statistics carry more uncertainty. Fewer trades means each trade has more statistical weight, and a bad run looks worse.
VolatiCloud's Monte Carlo simulation addresses this directly. By shuffling the trade sequence thousands of times, it shows you the 5th-percentile and 95th-percentile outcomes — the realistic worst and best cases, not just the average. For a regime-filtered strategy with 200 trades over a year, the p5/p95 confidence bands can be surprisingly wide. If the p5 outcome is still acceptable (say, −5% drawdown), the strategy is robust. If the p5 outcome is catastrophic, you need either more trades (tighter regime filter) or more conviction in the statistical properties.
See the Monte Carlo simulation guide for a detailed walkthrough of interpreting confidence bands.
A Practical Starting Point: The ATR-ADX Gate
If you're adding regime detection to an existing strategy and don't want to rebuild the whole logic tree, start with the minimal viable regime filter: an ATR-ADX gate.
The gate blocks all entries when:
- ATR > 200-period ATR average × 1.6 (crisis volatility), OR
- The strategy is trend-following AND ADX < 18 (not enough trend), OR
- The strategy is mean-reversion AND ADX > 28 (too much trend)
This simple two-condition gate often eliminates a strategy's worst losing trades without significantly reducing the win rate. It's fast to implement in the Strategy Builder's Logic tab and easy to backtest — compare the equity curve before and after adding the gate.
From there, you can layer in EMA slope, more sophisticated ATR normalization, or multi-timeframe confirmation as you gain confidence in the approach. Complexity should be earned through backtested evidence, not assumed to be better.
Two Worked Examples
A trend-regime RSI filter
The point of a regime gate is that it changes what a familiar signal means. Here is the same RSI you already know, read inside a confirmed trend:
Indicators: RSI(14), ADX(14), EMA(50)
Long entry (AND):
ADX(14) > 25— trending regimeclose > EMA(50)— upward directionRSI(14) < 40— a momentum dip inside that uptrend
Long exit: RSI(14) > 70, with an ATR-based stoploss (see ATR Stop-Loss Strategy).
Note the threshold: 40, not the classic 30. In a confirmed uptrend an RSI dip to 40 is usually a sharp pullback that recovers quickly. The identical RSI 40 reading in a ranging market could be a slow, messy bottom — or the start of a reversal. The regime filter is what separates those two cases; the RSI on its own cannot.
A range-regime configuration to backtest
If you prefer to start from a complete configuration rather than build one up, this is a reasonable range-regime baseline:
Strategy: Regime-Gated RSI Reversion
Timeframe: 1h
Pair: BTC/USDT

Indicators:
  ADX(14)
  RSI(14)
  BB(20, 2.0) → upper, lower, middle
  EMA(200)

Entry condition (AND):
  ADX(14) < 22           → ranging regime
  RSI(14) < 33           → oversold signal
  close > EMA(200)       → above long-term trend (avoid catching falling knives)
  close > BB_lower       → not in a breakdown

Exit:
  ROI: 1.5% in 8 candles, trailing to 0.8%
  Stop-loss: 2.5% (roughly 2x ATR on BTC/USDT 1h during low-volatility ranges)
Backtest it against 2022 ranging conditions and 2024 trending conditions separately. A working regime filter should perform reasonably in the range and do almost nothing in the trend — that inactivity is the filter succeeding, not failing, and it is the single easiest way to confirm the gate is wired up correctly.
Regime Detection Across Timeframes
One pattern is worth calling out on its own, because it solves the lag problem better than any threshold tweak: detect the regime on a higher timeframe, take entries on a lower one.
Reference the daily ADX for regime classification while executing on the 1-hour chart. When the daily ADX is trending (> 25) the hourly bot trades momentum signals; when the daily is ranging (< 20) it switches to RSI reversals. VolatiCloud's multi-timeframe indicator support lets you add ADX(14, timeframe=1D) alongside your primary timeframe's indicators, and a condition node simply references the daily-resolution value as a filter.
The result is regime stability at the macro level without being slow to react at the entry level — the higher timeframe changes its mind rarely, which is exactly what you want from a regime classifier. See the multi-timeframe strategies guide for the full mechanics.
Where to Go Next
Market regime detection is a broad topic, and the indicators discussed here are just the starting point. Once you have a working regime filter, the natural next steps are:
- Pair selection by regime: in trending regimes, focus on assets with the strongest momentum. In ranging regimes, focus on high-liquidity assets with stable mean-reversion behavior. VolatiCloud lets you run multiple bots on different pairs with independent regime filters.
- Regime-dependent position sizing: reduce position size in ambiguous regimes and increase it in high-confidence regime classifications. This naturally implements a form of dynamic risk management complementing the approach from risk management position sizing.
- Let a model learn the regime: instead of hand-picking ADX and ATR thresholds, train a FreqAI-native reinforcement-learning agent that learns its own adaptive policy from your market data and the reward you define.
VolatiCloud's Strategy Builder supports the full indicator set needed for regime detection — ATR, EMA, ADX, RSI — with configurable parameters on each. Build your regime conditions visually in the Logic tab, test across multiple date ranges in the backtesting interface, and deploy when the walk-forward results are consistent. Get started at console.volaticloud.com or read the strategy builder documentation to see exactly how condition nodes work.
Good regime awareness separates strategies that work during a specific historical period from strategies that hold up across market conditions. It's the difference between a backtest that looks impressive and a bot that survives the next regime shift.