Grid Trading Strategy for Crypto Bots: Build a Range-Bound Bot

Crypto markets spend a surprising portion of their time not trending — they oscillate sideways, testing the same support and resistance levels over and over. Grid trading is the strategy class built specifically for that environment: profit systematically from the bounce rather than waiting for a directional breakout.
Grid trading works by placing a ladder of buy orders below the current price and sell orders above it, at fixed intervals. Every time the price drops to a buy level, the bot opens a position; when it recovers to the paired sell level, the position closes at a small profit. Multiply that cycle by dozens of grids and hundreds of oscillations, and a flat market that frustrates trend-followers can generate consistent returns.
This guide explains how the strategy works mechanically, when it performs well, how to build and backtest a grid-inspired approach in VolatiCloud's Strategy Builder, and — critically — what kills grid bots and how to protect against it.
What Grid Trading Actually Does
The core mechanic is price-level arithmetic:
| Parameter | Example Value | What It Controls |
|---|---|---|
| Lower bound | $55,000 | Lowest buy level |
| Upper bound | $75,000 | Highest sell level |
| Grid count | 20 | Number of intervals |
| Grid spacing | $1,000 | ($75k − $55k) / 20 |
| Per-grid position | 0.1 BTC | Stake per interval |
With this setup, the bot holds a buy order every $1,000 from $55,000 to $74,000, paired with a corresponding sell order $1,000 higher. When BTC drops from $65,000 to $62,000, three buy orders fill; when it recovers to $65,000, those three positions close, each capturing $1,000 × 0.1 = $100 profit. The bot doesn't care whether the macro trend is up or down — it just needs price to keep oscillating.
Geometric vs Arithmetic Grids
Arithmetic grids use equal dollar spacing throughout the range. Simple to reason about, but they allocate the same capital to each interval regardless of where in the range you sit — upper intervals represent smaller percentage moves than lower ones.
Geometric grids use equal percentage spacing (e.g., every interval is 1% apart). More capital-efficient across a wide range and better suited to assets with high volatility ratios. For crypto, geometric grids are generally preferred over ranges wider than ±15%.
When Grid Strategies Work (and When They Don't)
Grid trading performs well when:
- Markets are range-bound. The strategy earns its edge from oscillations, not direction. A prolonged flat BTC-USDT period with regular bounces between $60k–$70k is ideal.
- Volatility is moderate. You need price to reach both buy and sell levels repeatedly. Too low volatility and grids never fill; too high and price blows through the entire range in one candle.
- Transaction fees are low. Each grid cycle involves two fills. On a tight $500 grid, a 0.1% maker fee eats $1 each way — your grid profit must exceed that margin to avoid bleeding out.
Grid strategies struggle when:
- Trend breaks out of range. A sustained move below your lower bound or above your upper bound leaves the bot fully long (or fully short) with unrealized losses. This is the primary risk.
- Price gaps over grid levels. High-impact news events can cause candles that skip several grids, creating oversized positions without the expected fill ladder.
- Bear markets. A grid that was set in a bull range slowly drifts below its lower bound and accumulates a large, losing long position.
Key insight: The maximum loss of a grid strategy isn't from normal oscillation — it's from a sustained directional move that exits the configured range. Position sizing and range selection matter more than grid count.
Building a Grid-Inspired Strategy in VolatiCloud
VolatiCloud's Visual Strategy Builder uses a condition-tree approach rather than hard-coded grid price levels, which means you build range-detection logic using indicators and price comparisons. This gives you more flexibility: instead of fixed dollar levels, you can anchor your grid bounds to dynamic indicators that adapt to changing market conditions.
Here's a practical grid-inspired setup using four building blocks:
Step 1: Define Range Bounds with Bollinger Bands
Bollinger Bands (20-period SMA ± 2 standard deviations) naturally define a dynamic price channel. The lower band acts as a buy trigger; the middle band (SMA) as an intermediate profit target; the upper band as a full exit.
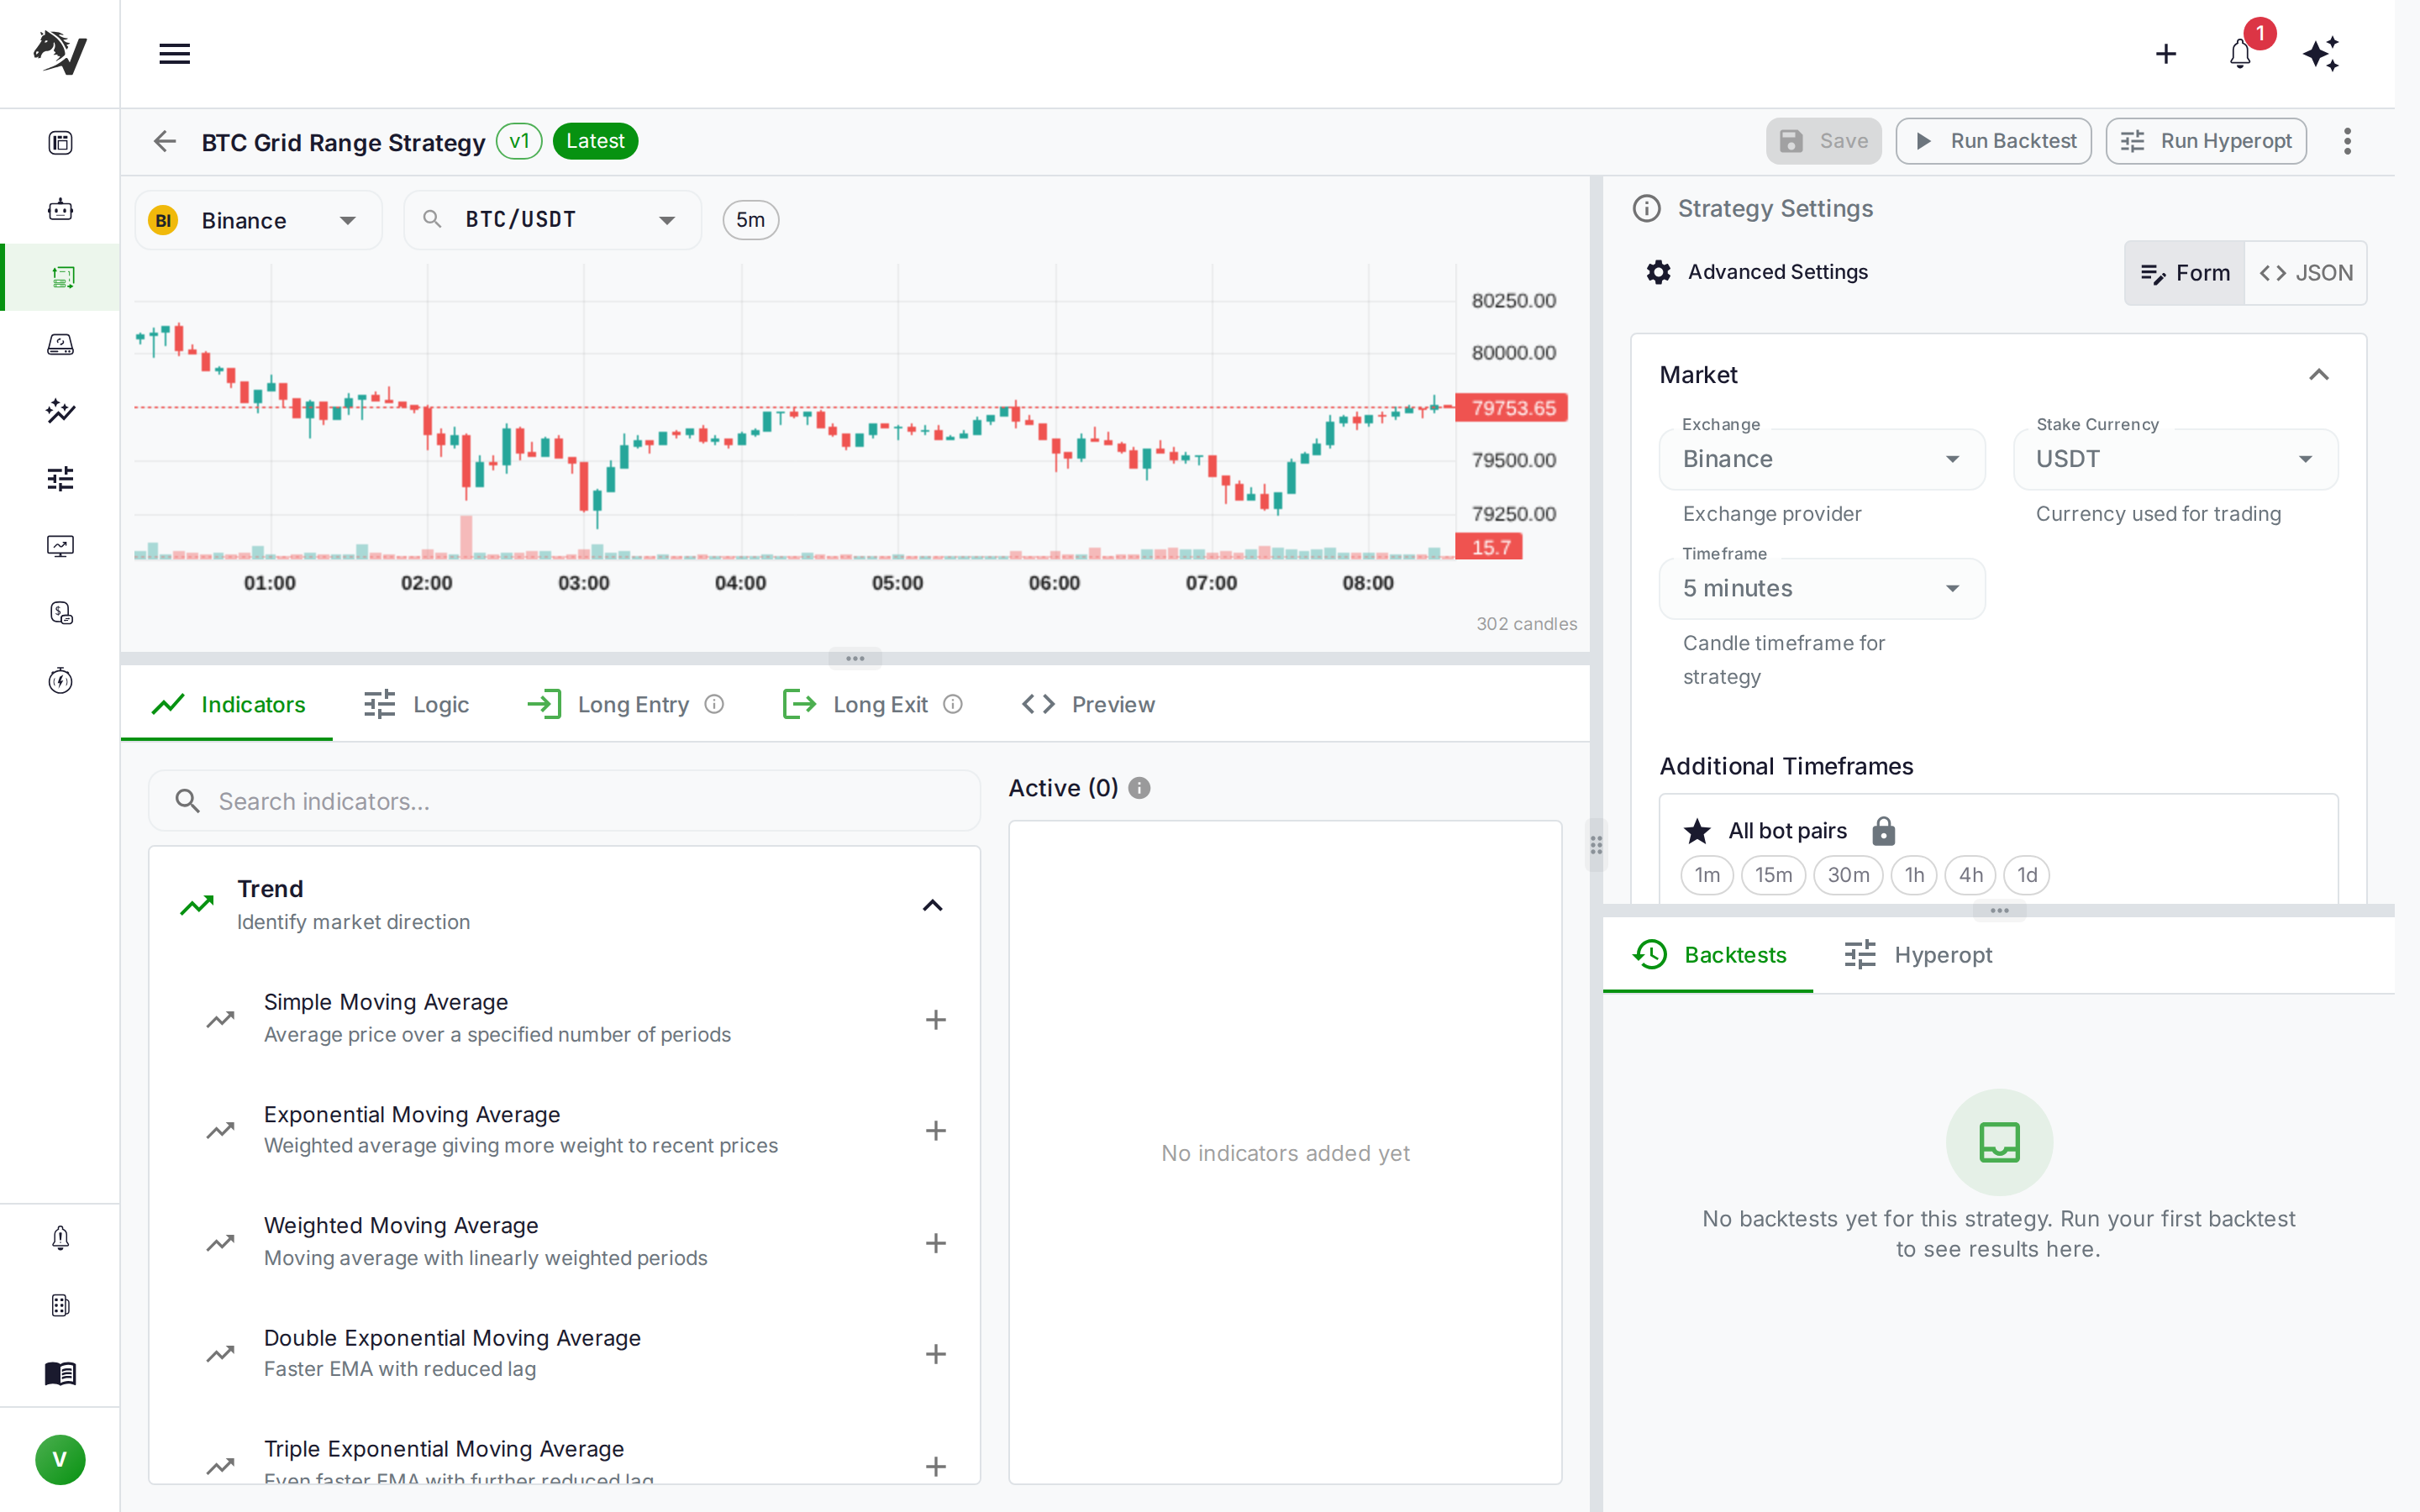
In the Indicators tab, add:
Bollinger Bandswith period20, deviation2.0- This generates three output values:
bb_lowerband,bb_middleband,bb_upperband
Step 2: Confirm the Market Is Range-Bound
Entering a grid strategy during a trending market is the primary failure mode. Use an ADX (Average Directional Index) filter to block entries when trend strength is high.
Add a second indicator:
ADXwith period14
Your entry will require adx < 25 — this threshold is the classic dividing line between ranging and trending markets.
Step 3: Layer Entries on Dips Within the Band
In the Logic tab, define your Long Entry condition:
ALL of:
  close < bb_lowerband × 1.005     ← price near/below lower band
  adx < 25                          ← market is ranging, not trending
  rsi_14 < 45                       ← not overbought at entry
The × 1.005 tolerance handles the case where price briefly touches the lower band without closing below it — a common real-world pattern where the candle wick triggers a fill but the close holds.
Add RSI (14) as a third indicator for the entry condition. RSI below 45 confirms the price is in the lower half of its short-term range without being in extreme oversold territory (which often precedes volatile bounces with poor fill quality).
Step 4: Set Profit Targets and Stops
Exit conditions drive grid profitability. A layered exit works well:
Long Exit — ANY of:
  close > bb_middleband             ← first partial exit at midpoint
  close > bb_upperband × 0.995     ← full exit near upper band
  rsi_14 > 70                       ← overbought — take profits
Stoploss is critical for grid strategies. Set it at –8% from entry (the VolatiCloud config panel, not a condition node), which corresponds roughly to 1.5× your expected grid spacing. This limits loss when price breaks below the range entirely.
Do not skip the stoploss configuration. A grid bot with no stoploss holding 20 layers of BTC during a bear market crash is how traders lose accounts, not just positions. Set it before running any backtest.
Configuring Key Parameters
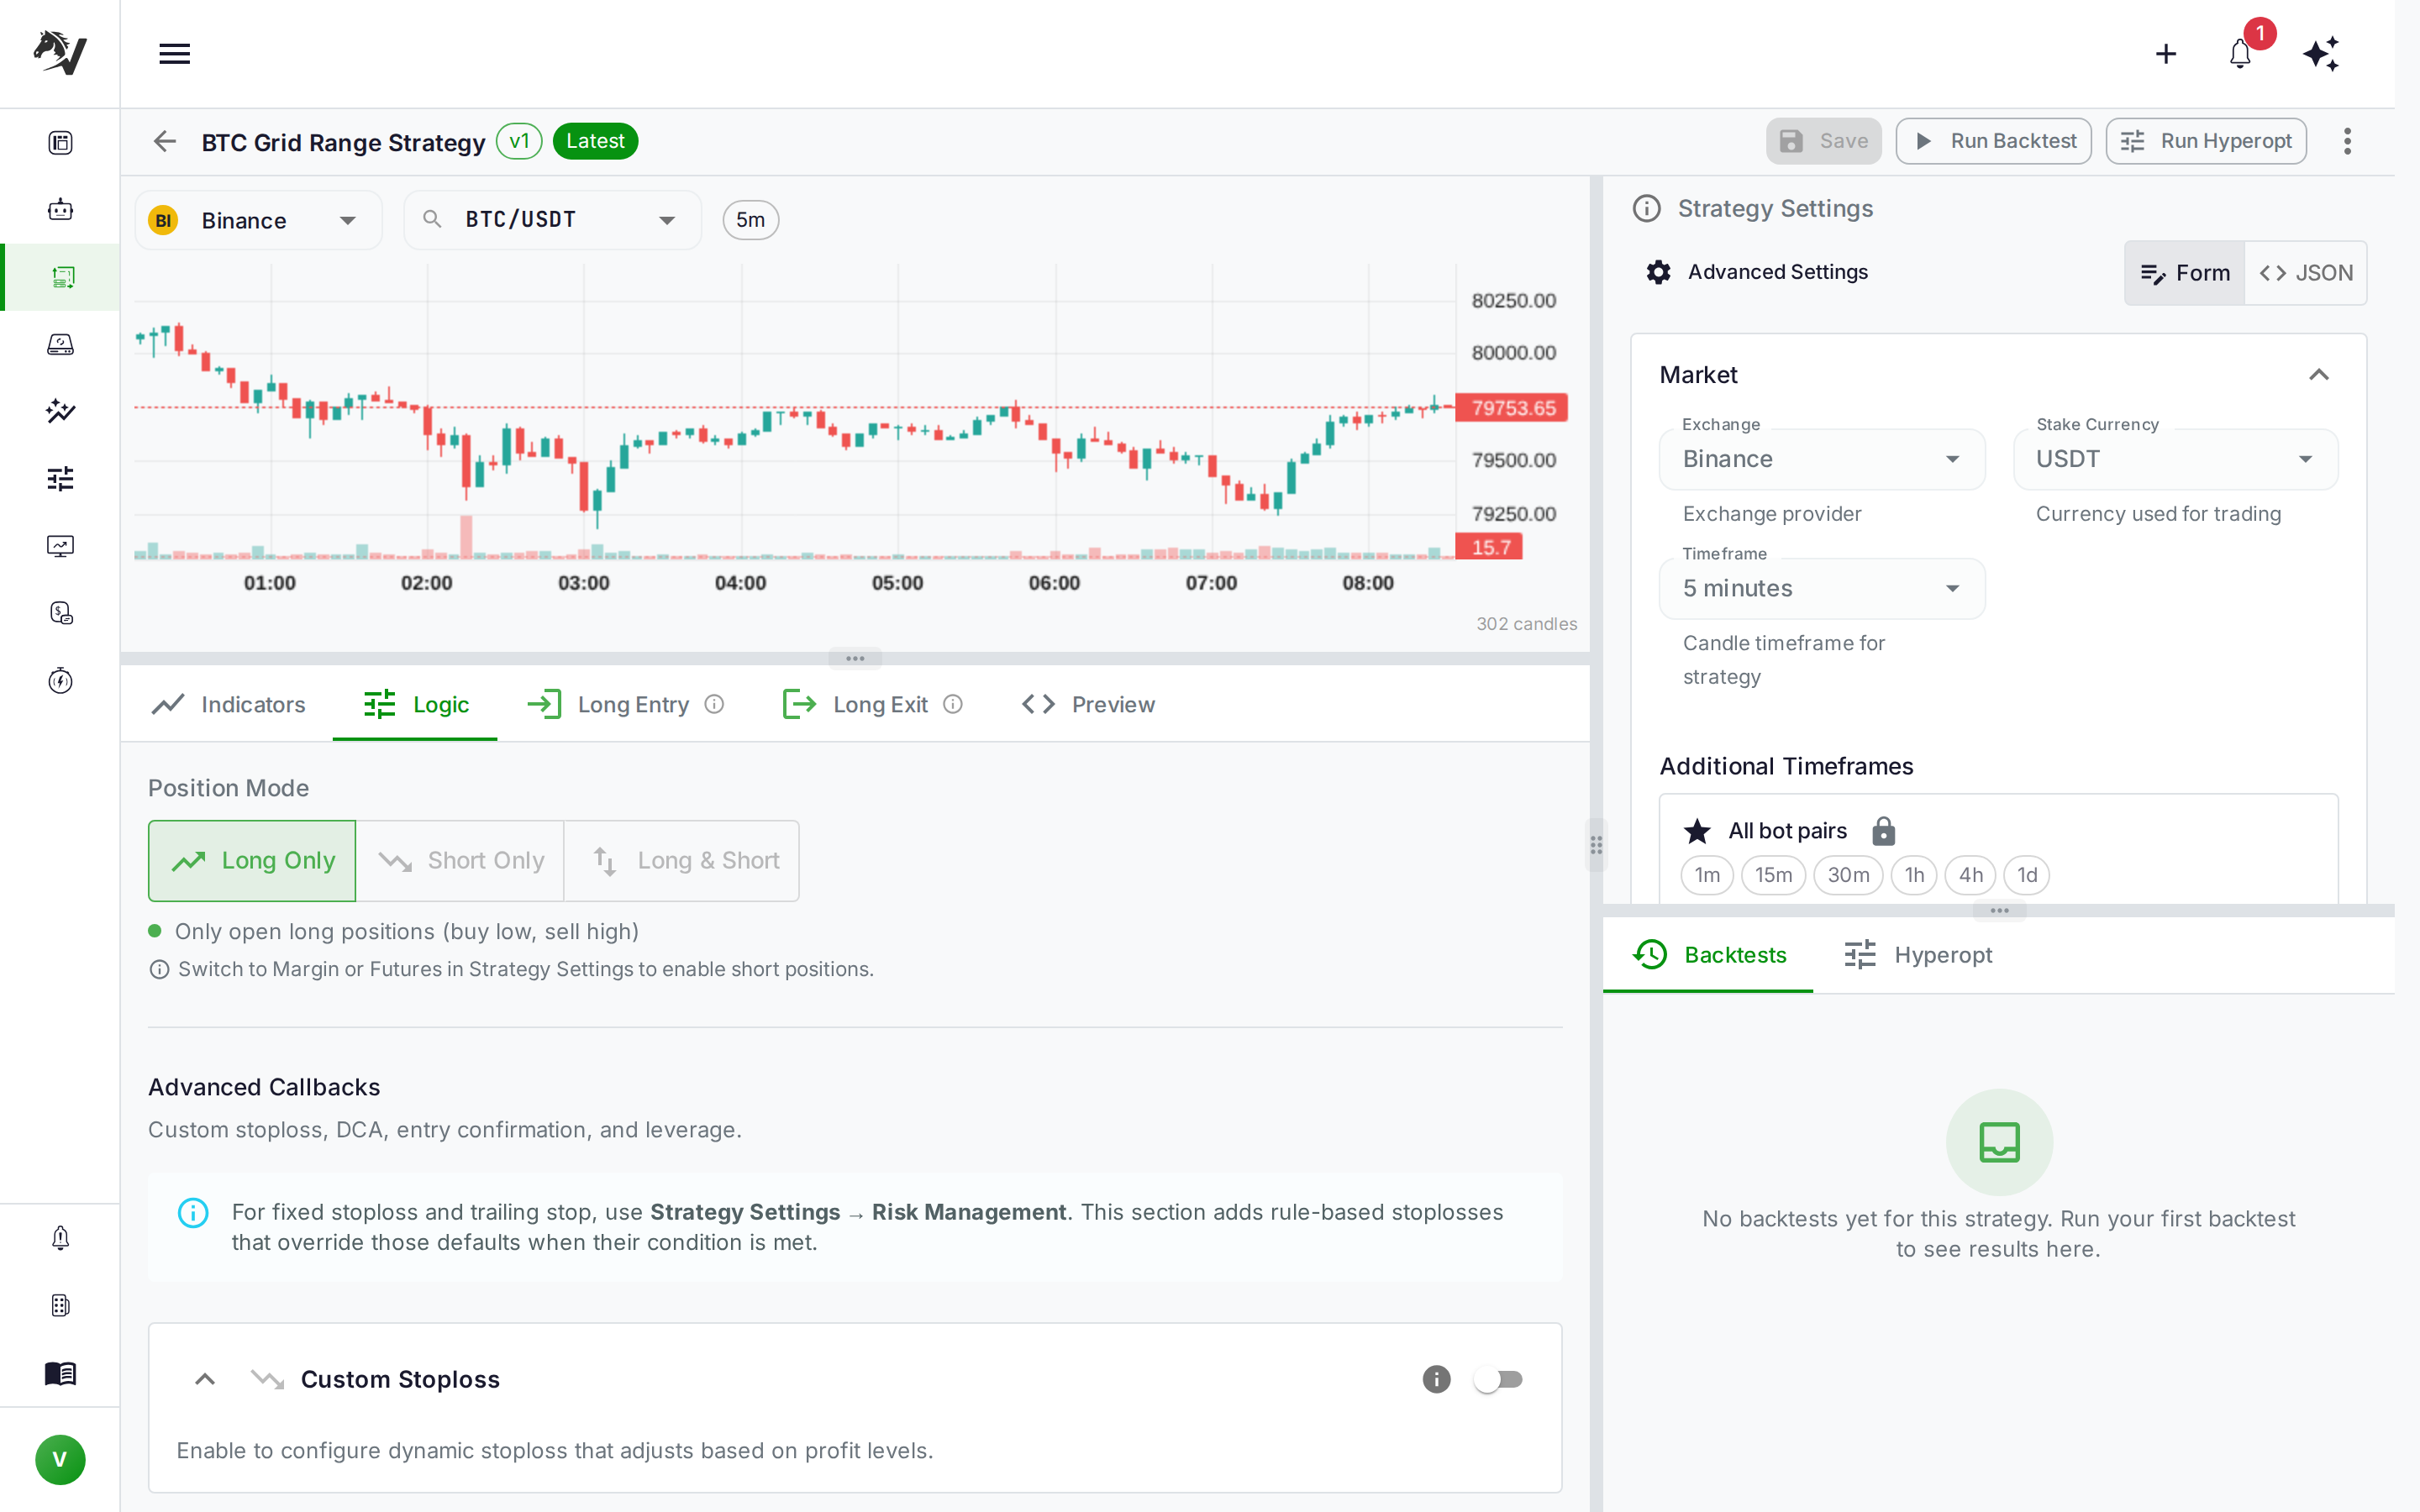
Once your condition tree is set, these settings in the Config panel directly determine your grid's risk/reward profile:
| Setting | Suggested Value | Reasoning |
|---|---|---|
| Timeframe | 1h | Hourly candles capture meaningful oscillations without over-trading |
| Stoploss | -8% | Limits single-position loss to ~1.5 grid spacings |
| Max open trades | 5–10 | Controls how many grid layers can be open simultaneously |
| Stake amount | Fixed, 2–5% per trade | Size each grid position as a fraction of total capital |
| Trailing stop | Off | Grid exits are condition-based; trailing stops fight the logic |
The max open trades setting is effectively your grid count. With 10 open trades allowed, up to 10 buy positions can accumulate as price falls through your range. With 5, the bot stops buying after the fifth dip — lower exposure but fewer captured bounces.
Backtesting Your Grid Strategy
Before running a grid strategy live, backtesting against a variety of market regimes is essential. A grid that looks brilliant on six months of 2023 range-bound BTC data may catastrophically underperform on 2022's bear market.
In VolatiCloud, launch a backtest from the Strategy Studio toolbar. For a grid strategy, pay particular attention to:
- Max drawdown. Grid bots naturally accumulate open positions during downtrends. A max drawdown above 20% suggests your range is too narrow or stoploss too loose.
- Win rate. Grid strategies should have high win rates (70%+) with small average wins. If win rate is below 60%, your entry conditions are too loose.
- Trade count. Low trade count (under 50 on a 1-year test) means your ADX filter is blocking too many valid entries. Relax the threshold from 25 to 30.
- Profit factor. Target above 1.5. Below 1.2 on historical data rarely improves in live trading.
Test at least three distinct market periods: a bull trend, a bear trend, and a sideways range. A robust grid strategy should show positive profit factor in all three, even if the sideways period dominates the returns.
See Backtesting Deep Dive for detailed guidance on interpreting Sharpe ratio, Calmar ratio, and profit factor in the context of mean-reversion strategies.
Hyperopt: Tuning Grid Parameters
Grid spacing, ADX threshold, and RSI bounds all benefit from optimization. In VolatiCloud's Hyperparameter Optimization tool, set these as your search space:
# Suggested Hyperopt space for grid parameters
adx_threshold = IntParameter(15, 35, default=25, space='buy')
bb_period = IntParameter(15, 30, default=20, space='buy')
bb_deviation = DecimalParameter(1.5, 2.5, default=2.0, decimals=1, space='buy')
rsi_buy = IntParameter(30, 50, default=45, space='buy')
rsi_sell = IntParameter(60, 80, default=70, space='sell')
Use Sharpe Ratio as the hyperopt loss function (not pure profit) — it penalizes strategies that hit high profits by taking on excessive risk, which is exactly the failure mode for over-fitted grids.
Run at least 500 epochs to get statistically meaningful results across the parameter space, then walk-forward validate the winners on out-of-sample data. The Walk-Forward Optimization guide covers this validation step in detail.
Risk Management: What Kills Grid Bots
Grid strategies have a specific failure profile that differs from trend-following bots. Understanding it prevents the most common account-blowing scenarios:
Range breakout. When price exits your configured range and doesn't return, you accumulate unrealized losses on all open positions. Mitigation: set a hard stop at the bottom of your range (the stoploss config), and consider a circuit-breaker rule that pauses the strategy if 3+ positions are simultaneously in drawdown.
Over-allocation. Running a grid with 10 open positions at 5% stake each means 50% of your capital is committed at the bottom of a move. Reduce individual stake size as you increase max open trades. A 10-position grid should use 2–3% per position, not 5%.
Fee drag. On tight 0.5–1% grids with a 0.1% fee per fill, fees consume 20–40% of gross profit. Either widen your grid spacing or trade on exchanges with maker rebates. Always include realistic fees in backtests — VolatiCloud uses your configured fee rate for all simulations.
Wrong timeframe. A 5-minute grid generates hundreds of tiny trades and amplifies fee drag. A 4-hour grid misses short oscillations entirely. For most crypto pairs, 1-hour or 2-hour candles hit the sweet spot for grid-style strategies.
Getting Started
A grid strategy is a good second bot once you've validated your workflow with a simpler trend-following strategy. The extra parameters (range bounds, grid count, ADX filter) make it slightly more complex to configure correctly, but the underlying logic is transparent and testable.
Suggested path:
- Build the four-indicator setup above in VolatiCloud's Strategy Builder
- Backtest against 12 months of data on BTC/USDT and at least two altcoins
- Compare results across bull, bear, and sideways sub-periods using VolatiCloud's analyzing results tools
- Run paper trading for at least two weeks before committing real capital (see Paper Trading to Live)
- Start with 2–3% per grid position and scale up only after observing live performance
VolatiCloud's Visual Strategy Builder makes this setup entirely no-code: drop in your indicators, connect your conditions, hit Run Backtest. No Python editing, no local development environment, no platform administration.
Ready to build your first range strategy? Open the Strategy Builder and use the Bollinger Bands + ADX configuration above as your starting point.