Volume Indicators for Crypto Bots: OBV, VWAP, MFI, and CMF

A 4% rally on three times average volume tells a different story from a 4% rally on thin volume — but a price-only bot trades them identically. That's the gap volume indicators close. They answer the one question price alone never can: is this move backed by real participation? OBV, VWAP, MFI, and CMF each tackle the question differently, and all four are wired into VolatiCloud's Strategy Builder as first-class indicator nodes.
This post covers how each indicator works, what market condition it's suited for, and how to add it to a strategy. By the end you'll have a concrete blueprint for layering volume confirmation onto the price-based logic you're already running.
Why Volume Matters More in Crypto Than Equities
In equity markets, volume data is centralized per exchange. In crypto, volume is fragmented across dozens of venues, so absolute figures are less meaningful than relative changes. What matters is whether this candle's volume is higher or lower than recent candles, and what direction price moved during that volume.
This relative framing is good news for algorithmic traders. Volume-based indicators don't require perfect data — they work on percentage differences and running sums, which means exchange-specific quirks wash out over time. That's why OBV and CMF translate directly from traditional markets to crypto with minimal adjustment.
OBV: On-Balance Volume
On-Balance Volume (OBV) is a cumulative indicator that adds volume on up-candles and subtracts volume on down-candles. The formula is simple:
OBV(t) = OBV(t-1) + volume(t)  [if close(t) > close(t-1)]
OBV(t) = OBV(t-1) - volume(t)  [if close(t) < close(t-1)]
The absolute value of OBV is meaningless. What matters is its direction and divergence relative to price.
OBV Divergence Signals
The most reliable OBV signal is divergence:
| Price action | OBV action | Signal |
|---|---|---|
| New high | Fails to make new high | Bearish divergence — rally may stall |
| New low | Fails to make new low | Bullish divergence — selloff may reverse |
| Sideways | Rising | Accumulation — upside breakout likely |
| Sideways | Falling | Distribution — downside breakout likely |
In a bot, OBV divergence is best used as a filter, not a standalone entry. For example: only take a buy signal from your RSI or EMA system if OBV is also trending upward over the last N candles. That single addition cuts out many false entries during sideways, low-conviction price action.
VWAP: Volume-Weighted Average Price
VWAP is the running average of price weighted by volume traded at each price level. It resets daily (or per session) and answers the question: "compared to where most volume was traded, is price above or below fair value?"
VWAP = Σ(typical_price × volume) / Σ(volume)
Where typical_price = (high + low + close) / 3.
How to Use VWAP in an Automated Strategy
VWAP is more useful as a reference level than a momentum signal. Common applications:
- Mean reversion — Price far below VWAP → long bias; price far above → short bias
- Trend confirmation — Price consistently above VWAP → trend is healthy; sustained break below → momentum weakening
- Entry quality filter — Only enter longs when price is reclaiming VWAP after a dip, rather than chasing a price already stretched far above it
One natural pairing: combine VWAP with a trend indicator like EMA. Enter longs when price is above both VWAP and the 50-period EMA, exit when price breaks below VWAP. This filters out counter-trend trades that EMA crossovers alone would generate.
VWAP resets at session open. On 24/7 crypto markets, VolatiCloud maps this to the UTC midnight boundary. Intraday timeframes (5m, 15m, 1h) show VWAP clearly; on daily charts it converges toward the typical price and loses utility.
MFI: Money Flow Index
The Money Flow Index (MFI) is often called "RSI with volume." It calculates buying and selling pressure by combining price direction with volume magnitude, then normalizes the result to a 0–100 scale.
Money Flow Ratio = Positive Money Flow / Negative Money Flow
MFI = 100 - (100 / (1 + Money Flow Ratio))
Where money flow = typical price × volume, positive or negative based on whether typical price rose or fell.
Interpreting MFI
| MFI level | Interpretation |
|---|---|
| > 80 | Overbought — heavy buying volume may be exhausting |
| < 20 | Oversold — heavy selling volume may be capitulating |
| Divergence with price | Leading signal, similar to OBV divergence |
MFI is more sensitive to volume spikes than RSI. A single very large candle can push MFI into overbought territory even if price hasn't moved that far, which makes it a better early-warning tool for blow-off tops. High-volume selling that pushes MFI to 15–20 often precedes short-term reversals.
The practical difference from RSI: RSI can show "overbought" during a strong trend and stay there for days. MFI tends to revert faster when the volume behind the move is fading, which can give a more actionable exit signal.
CMF: Chaikin Money Flow
Chaikin Money Flow (CMF) measures whether a coin is being accumulated or distributed over a lookback window (typically 20 periods). It uses the Money Flow Multiplier — a measure of where price closed within the candle's high-low range — weighted by volume.
Money Flow Multiplier = ((close - low) - (high - close)) / (high - low)
CMF = Σ(MF Multiplier × volume) / Σ(volume)  over N periods
CMF oscillates between -1 and +1:
- CMF > 0 — Net accumulation; more volume is flowing into the asset
- CMF < 0 — Net distribution; more volume is flowing out
- CMF > 0.25 or < -0.25 — Strong accumulation/distribution worth trading
The advantage over OBV: CMF is normalized and bounded, making it directly comparable across different assets and timeframes. OBV is a running cumulative sum that grows indefinitely; CMF resets its window each period.
Building a Volume-Confirmed Strategy in VolatiCloud
All four indicators (OBV, VWAP, MFI, CMF) are available as first-class indicator nodes in VolatiCloud's Strategy Builder. Here's a practical entry condition that uses MFI as a volume confirmation layer on top of an EMA trend filter.
Example: EMA Trend + MFI Confirmation
Entry conditions (AND logic):
EMA(20) CROSSOVER_ABOVE EMA(50)— trend turns bullishMFI(14) > 40— meaningful buying pressure behind the move (avoids entries on volume-starved signals)VWAP < close— price has reclaimed VWAP, confirming institutional buy interest
Exit conditions:
MFI(14) > 75— selling into overbought volume conditionsclose CROSSOVER_BELOW VWAP— price breaks below fair value
In the Strategy Builder, create an AND node at the top level, then attach each of these as COMPARE or CROSSOVER child nodes. The MFI node takes a period parameter (14 is standard); VWAP takes no parameters since it's session-based.
This is a concrete application of multi-indicator confluence. Rather than one indicator giving all signals, each handles what it does best: EMA tracks trend direction, MFI confirms volume participation, and VWAP anchors the entry to a rational price level.
A strategy entry confirmed by three independent signals — price trend, volume quality, and fair value position — will have a lower win rate than a simple RSI crossover, but the wins will tend to be larger and the losses shallower. Fewer, better trades.
Backtesting Volume Strategies
Volume indicators introduce a practical concern: they're only as good as the volume data feeding them. When backtesting volume-confirmed strategies on VolatiCloud:
Choose exchanges with quality volume data. Binance and Bybit have deep order books and reliable tick data. Some smaller exchanges have inflated volume figures, which will give misleading MFI and OBV readings. The market data lake post covers how VolatiCloud's shared historical data is sourced.
Use appropriate timeframes. VWAP is most useful on intraday timeframes (5m to 4h). OBV and CMF work well on daily charts for position entries. MFI is reliable across timeframes but most actionable on 1h and 4h.
Check for parameter sensitivity. After running a backtest, run hyperparameter optimization on your MFI and CMF periods. If only a very narrow range of values (e.g., period=14 only) produces positive results, the strategy may be overfit to historical data. The overfitting guide covers a structured methodology.
The backtesting overview and analyzing results docs walk through the full workflow once your strategy is built.
Combining Volume with Price Indicators
Volume indicators are most powerful as confirmation layers, not primary signals. Three pairings that work well:
| Volume indicator | Best paired with | Why |
|---|---|---|
| OBV | EMA crossovers | OBV confirms whether the crossover has volume backing |
| VWAP | RSI mean reversion | VWAP provides a fair-value anchor for reversion trades |
| MFI | Bollinger Band breakouts | MFI confirms whether a band touch has volume behind it |
| CMF | Trend-following systems | CMF detects accumulation before trend moves materialize |
For example, if you already have a Bollinger Bands strategy, adding CMF(20) > 0.1 before entering a breakout meaningfully reduces false signals on range-bound markets where price touches the upper band without real buying pressure. The same applies to breakout strategies — volume confirmation is one of the highest-leverage filters you can add.
Configuring Volume Indicators in the Strategy Builder
In VolatiCloud's Strategy Builder, adding any of these indicators follows the same pattern:
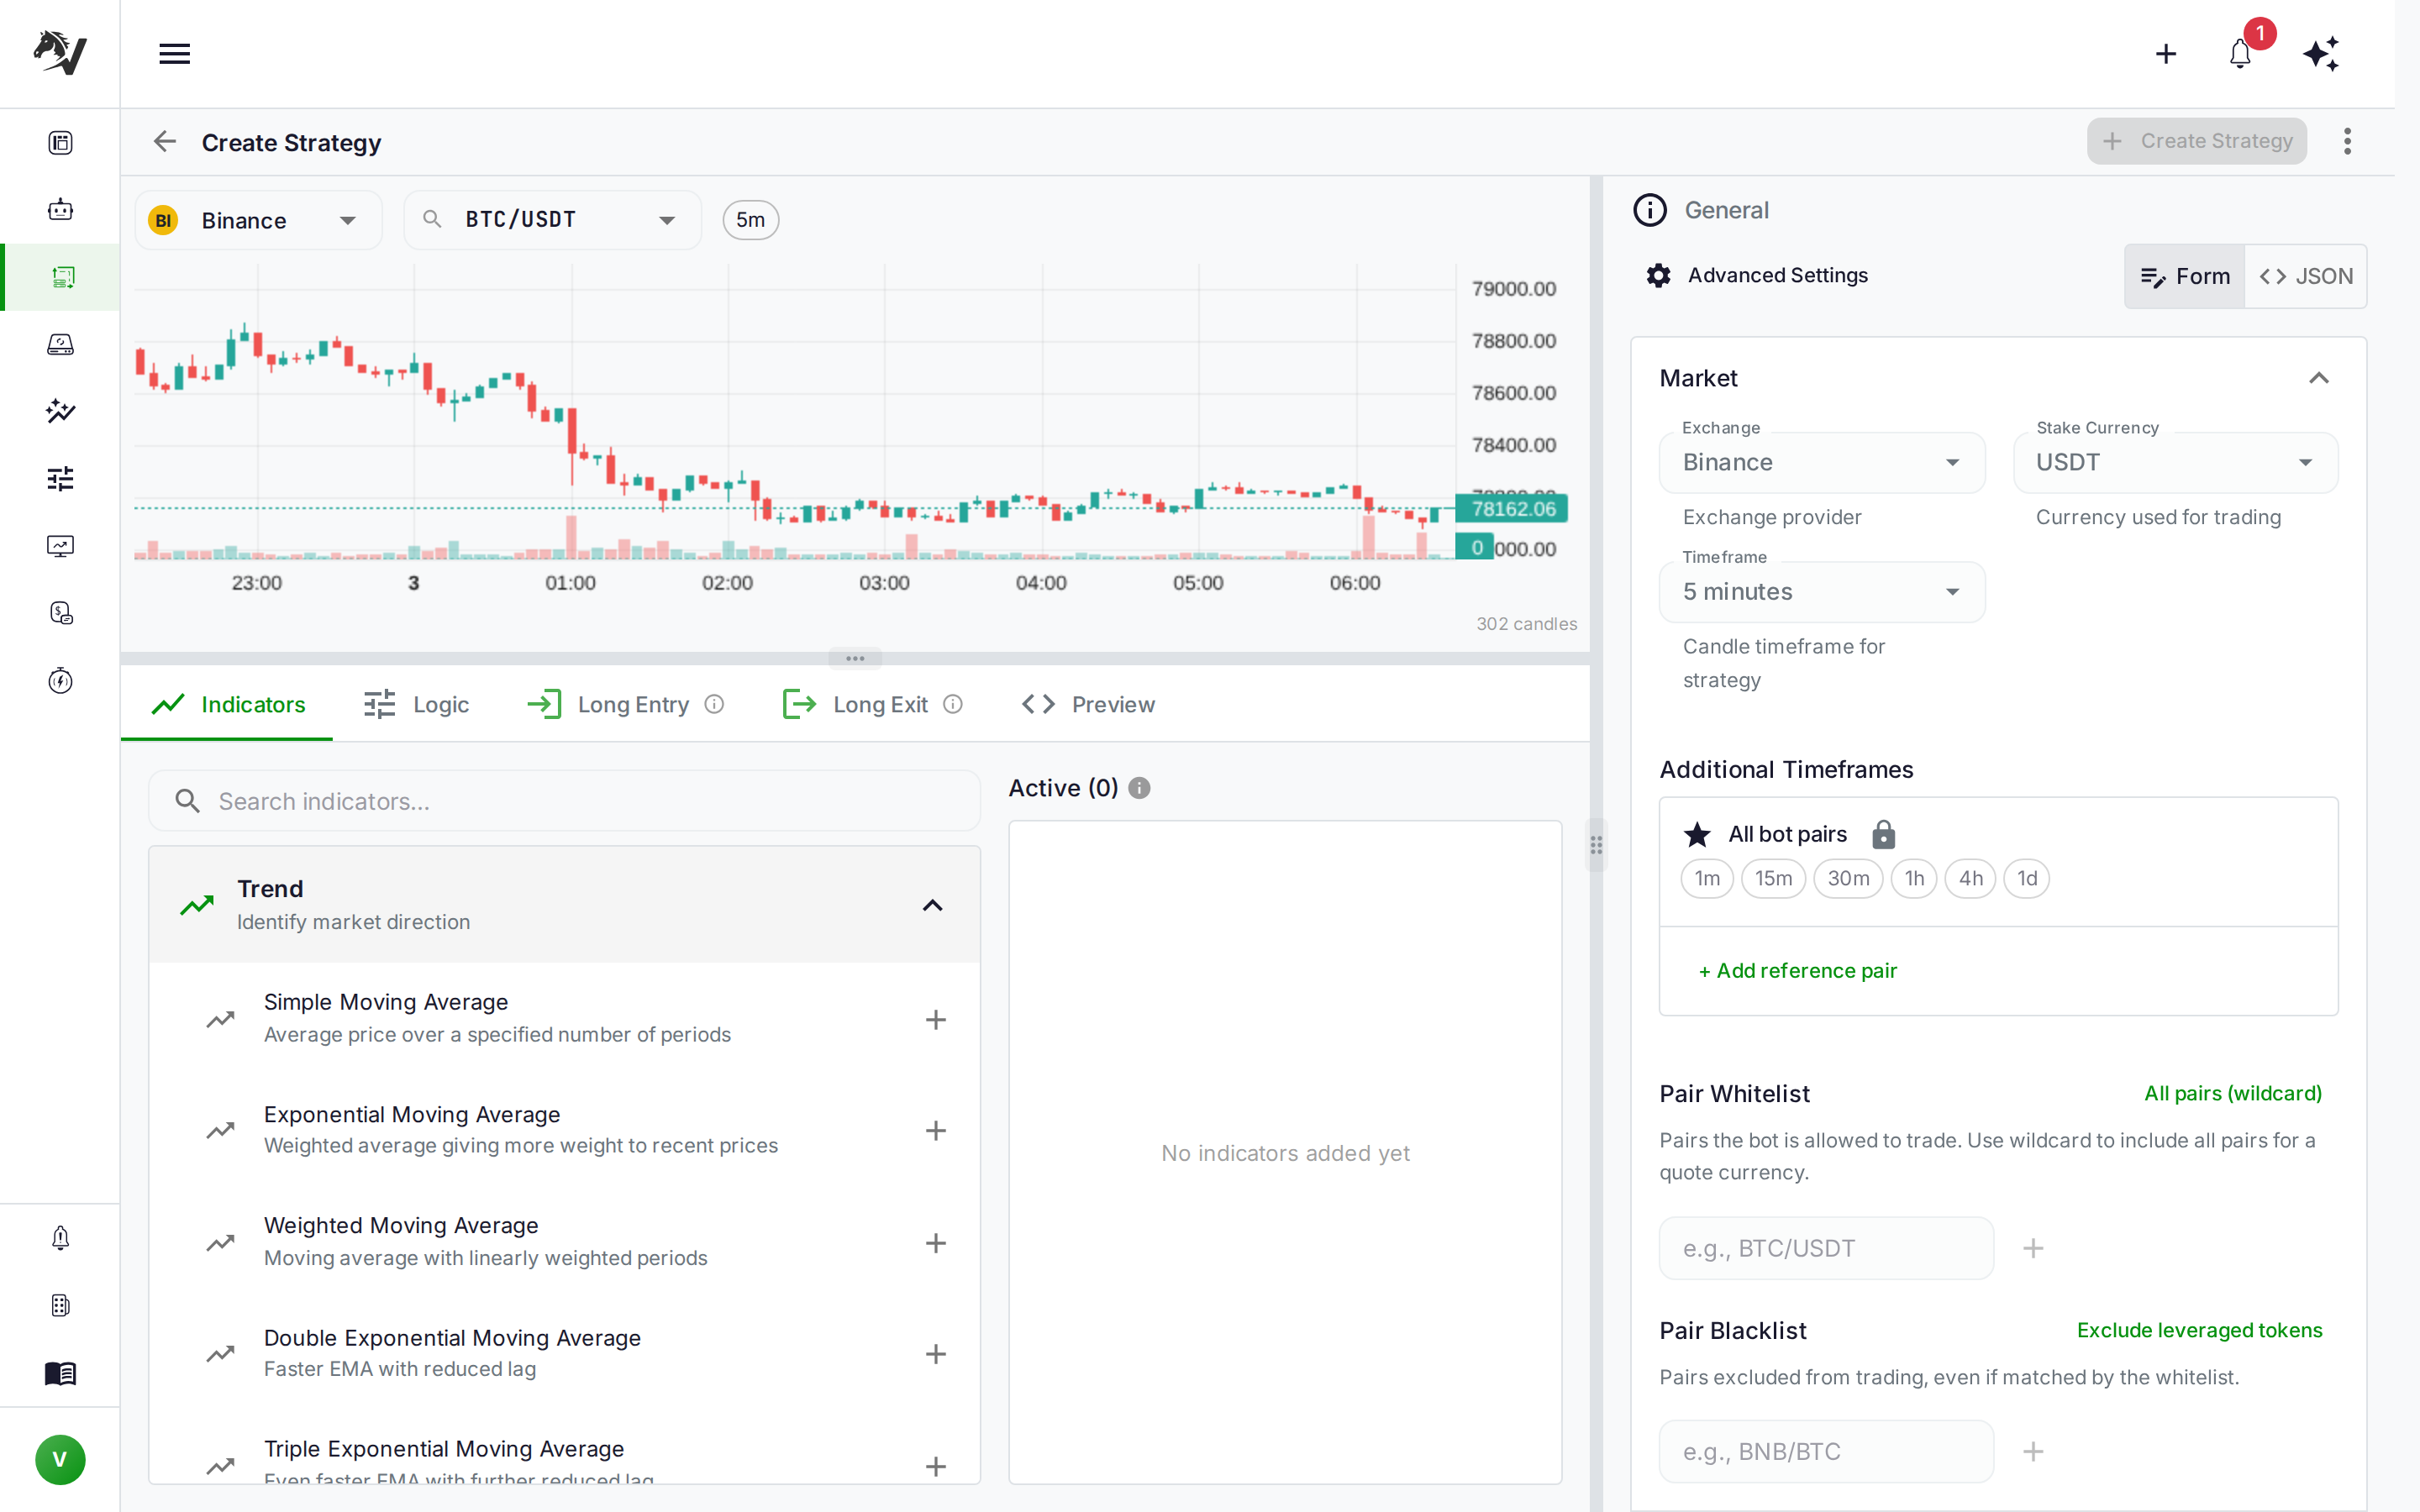
- Open the Indicators tab
- Search for the indicator name (OBV, VWAP, MFI, CMF, or AD for Accumulation/Distribution)
- Set the period parameter where applicable
- Drag the indicator into your condition tree as an operand
- Choose the comparison:
COMPAREfor threshold checks,CROSSOVERfor direction changes
The indicator is then available in both your entry and exit condition trees. Because VolatiCloud generates Freqtrade-compatible strategy code from the visual builder, the indicator will be applied consistently in backtesting, hyperopt, and live trading — no custom code required.
For strategies that need more control — custom smoothing, non-standard periods, or combinations the visual builder doesn't support — Code Mode lets you write the indicator logic directly in Python while still using the platform's backtest infrastructure and bot lifecycle management.
Practical Tips
Don't stack volume indicators redundantly. OBV, CMF, and MFI all measure volume flow but in slightly different ways. Putting all three in one strategy doesn't triple the signal strength — they're correlated, so adding more doesn't add more confirmation. Pick the one that fits your strategy's logic.
Volume indicators lag on tick-based assets. Perpetual futures with high funding rates can have volume spikes that are funding-driven rather than directional. If you're trading perps, test whether your volume indicator's signal holds after excluding the 8-hour funding settlement periods.
VWAP reset frequency matters. On 4h and daily charts, session-based VWAP may not capture the relevant price level. Consider using a 20-period VWAP (a rolling VWAP equivalent) rather than session-based VWAP for those timeframes.
Start Building Volume-Confirmed Strategies
Volume indicators close the gap between "price moved" and "price moved with conviction." OBV catches divergence before price reverses. VWAP anchors your entries to where real trading happened. MFI tells you if the volume behind a move is sustainable. CMF shows whether smart money is accumulating or distributing.
All four are ready to use in VolatiCloud's Strategy Builder without writing a single line of code. If you're already running an EMA or RSI-based strategy, adding one volume condition is often the cheapest improvement you can make — one extra node in your condition tree, and the backtest will tell you whether it earns its place.
Head to the VolatiCloud console to open your strategy and add your first volume indicator. If you're building from scratch, the Strategy Builder guide walks through the full interface.