Crypto Breakout Strategies: Build, Backtest, and Automate Them

The largest price moves in crypto don't happen during quiet, consolidating markets — they happen when price breaks out of a range and momentum takes over. A well-designed breakout strategy targets exactly these moments: catching the transition from compression to expansion, then riding the move with disciplined risk management. The hard part is distinguishing a real breakout from a fakeout — and that's where most naive "buy the new high" strategies fall apart.
Building a reliable breakout system requires the right indicator combinations, strict entry filters, and rigorous backtesting before risking real capital. This post walks through each piece — what to use, why it works, and how to assemble it into a strategy you can deploy.
What Makes a Breakout?
A breakout occurs when price moves decisively outside a previously established range — a horizontal consolidation zone, a volatility squeeze, or a key support/resistance level. Markets oscillate between contraction phases (tight ranges, falling volatility) and expansion phases (directional moves, rising volatility). Breakout strategies enter at the boundary between these phases.
Three types of breakouts appear most consistently in crypto markets:
| Type | Trigger | Best for |
|---|---|---|
| Range breakout | Price exits a horizontal consolidation zone | Sideways markets with clear levels |
| Volatility squeeze breakout | Price escapes a Bollinger Band or ATR compression | All market regimes |
| Momentum continuation | Price breaks a short consolidation within a larger trend | Trending markets |
Each type needs slightly different detection logic, but all share one requirement: confirmation. An unconfirmed breakout entry is usually a trap.
Indicators That Identify High-Probability Breakouts
Bollinger Band Width — Detecting the Squeeze
Bollinger Bands contract during low-volatility consolidation. When the bands narrow to a multi-period minimum — commonly called a "squeeze" — price is coiling before a directional move. The breakout fires when price closes outside the band after the squeeze.
Bollinger Band Width (BBW) quantifies the squeeze:
BBW = (Upper Band − Lower Band) / Middle Band
When BBW drops below its 20-period minimum and then price closes above the upper band, you have a volatility expansion breakout signal. The full mechanics of Bollinger Band configuration — period and standard deviation settings — are covered in the Bollinger Bands strategy guide.
ATR Expansion — Confirming Volatility Is Real
Average True Range measures how much price moves bar-to-bar. During consolidation, ATR falls. When it begins rising at the same time price is clearing a level, it confirms the breakout is backed by genuine volatility expansion rather than a thin-market spike.
A practical filter: only take a breakout signal if current ATR is above its own 20-period simple moving average. This avoids choppy markets where breakouts stall and reverse quickly. ATR also serves as the basis for stoploss placement — positioning the stop at 1–2× ATR below the breakout candle's low keeps risk proportional to current market conditions. The ATR stop-loss guide covers this in detail.
Volume Surge — The Institutional Fingerprint
Price breakouts backed by above-average volume are significantly more reliable than those occurring on thin volume. A volume surge signals that larger participants are driving the move, not just a cluster of retail stop orders.
A simple volume filter:
Volume > 1.5 × Volume_SMA(20)
If volume doesn't confirm the breakout, the probability of a fakeout rises sharply. On-Balance Volume (OBV) provides an even richer signal — if OBV was already trending upward before the price breakout, it indicates accumulation that predates the visible move. The volume indicators guide covers OBV, VWAP, and MFI configurations.
RSI as a Momentum Filter
RSI above 50 on a long breakout (below 50 on a short) confirms momentum supports the direction. RSI in the 50–70 range on a long entry means you're not chasing an overextended move. This filter removes many fakeouts that occur when price briefly pierces resistance before reversing.
Building a Breakout Strategy in VolatiCloud
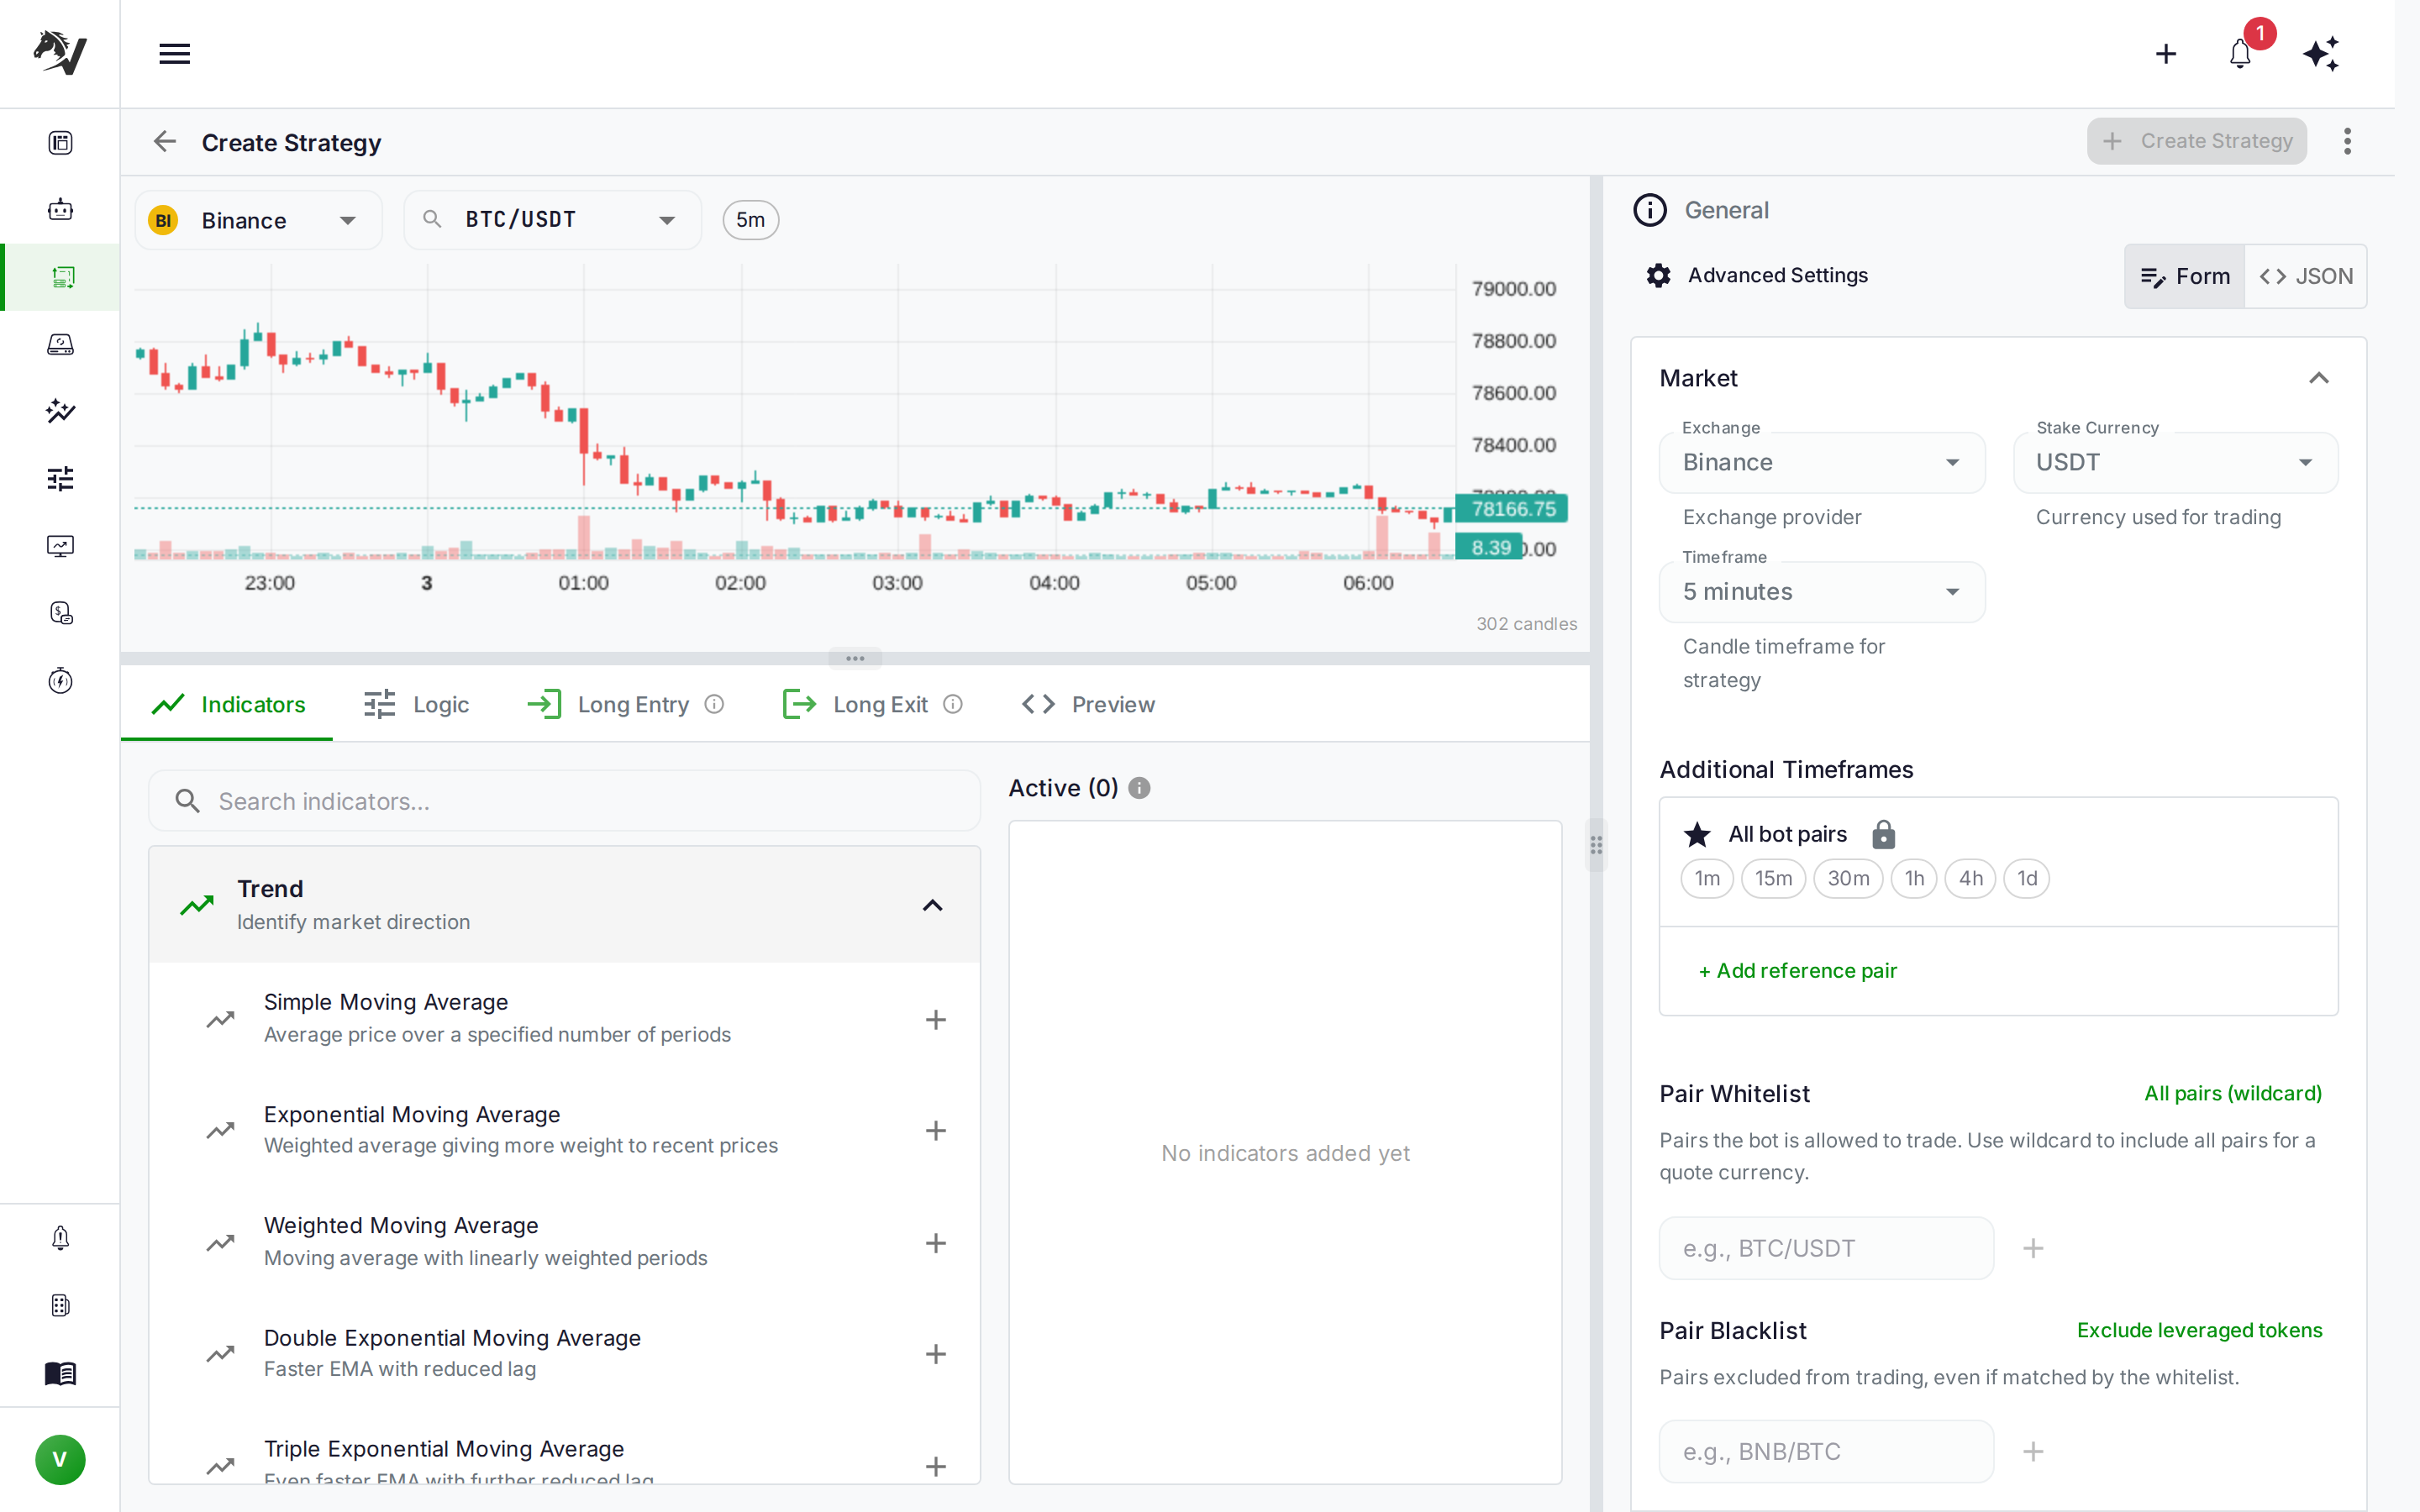
VolatiCloud's Strategy Builder lets you combine these indicators into a working breakout system without writing code. Each indicator becomes a node in a visual logic tree, connected by AND/OR conditions that define your entry rules.
Entry Logic — Long Breakout
AND [
  BBW < BBW_Min(20)         — squeeze confirmed
  Close > BB_Upper          — breakout direction confirmed
  Volume > Volume_SMA × 1.5 — volume confirmation
  RSI(14) between 50 and 70 — momentum without overextension
  ATR(14) > ATR_SMA(20)     — volatility expanding, not contracting
]
In the Strategy Builder, each condition becomes a Compare node. The full AND group connects them. The indicator library includes Bollinger Bands (configurable period and standard deviation), RSI, ATR, SMA, and volume nodes — all draggable into the canvas. You set parameters directly on each node, and the builder validates that the logic is complete before saving.
Exit Conditions
Breakout strategies need exits that let momentum run while protecting profits:
- Initial stoploss — Place below the breakout candle's low, using 1–2× ATR as the buffer
- Trailing stoploss — Once the trade moves in your favor, activate a trailing stop of 1.5–2× ATR to lock in gains as the move continues
- Take profit (optional) — A fixed target at 3–4× the stoploss distance enforces a minimum risk/reward ratio and exits before momentum exhausts
VolatiCloud lets you configure all three simultaneously in the bot settings — stoploss, trailing stoploss activation threshold, and take profit — so the bot manages exits automatically once the entry fires.
Short Breakouts with Mirror Mode
If your exchange supports short selling, you can run the same breakout logic in both directions. When price breaks below the lower Bollinger Band with volume confirmation and RSI below 50, that's a short entry. VolatiCloud's Long/Short mirror mode mirrors your strategy logic automatically, doubling the number of setups your bot can trade without requiring a separate strategy.
Backtesting a Breakout System Properly
Breakout strategies are particularly prone to curve-fitting. A period with a few large trending moves can make a breakout strategy look excellent on paper, but if the historical data doesn't include range-bound regimes, the backtest is misleading.
Use Enough History
You need the strategy to encounter multiple market regimes — bull, bear, sideways, high volatility, low volatility. At minimum, test over 12–24 months of data. VolatiCloud's market data lake provides historical OHLCV from exchange inception for major pairs across Binance, Kraken, and other supported exchanges. Verify data availability directly in the backtest setup before committing to a date range — the historical data availability post explains what the pre-flight check looks like.
Split Training and Evaluation Periods
Never optimize parameters on the same data you use for final evaluation. A clean workflow:
- Training window (e.g., Jan 2023 – Dec 2023) — Use Hyperopt to find optimal BB period, ATR multiplier, and RSI threshold
- Out-of-sample window (e.g., Jan 2024 – Jun 2024) — Run the optimized parameters on data the optimizer never saw
If performance collapses on the out-of-sample window, the strategy is overfit. Walk-forward optimization formalizes this process across rolling windows and is the standard approach for validating breakout systems.
Interpreting Backtest Results
When analyzing backtest results, breakout strategies have a characteristic profile: lower win rates but higher average win-to-loss ratios. Target these metrics:
| Metric | What to Look For | Why |
|---|---|---|
| Win rate | 35–50% | Low is expected — breakouts fail often |
| Profit factor | > 1.5 | Winners must significantly outpace losers |
| Max drawdown | < 20% | Equity curve can be volatile; bound the risk |
| Sharpe ratio | > 0.8 | Measures return earned per unit of volatility |
| Average win / Average loss | > 2.0 | Risk/reward must be positive |
A 40% win rate with a 1:3 average risk/reward ratio is mathematically profitable. Optimizing for win rate in a breakout strategy often destroys the edge — you end up filtering out the big winners along with the losers.
Realistic Execution Assumptions
Breakouts execute during high-volatility moments when spreads widen. Add realistic slippage in your backtest configuration:
- Major pairs (BTC/USDT, ETH/USDT) — 0.05–0.1% slippage
- Mid-cap pairs — 0.1–0.2% slippage
- Exchange fees — Include maker/taker fees for your exchange — these compound significantly over hundreds of trades
Ignoring execution costs is one of the most common reasons backtests look better than live trading. The overfitting and backtesting pitfalls guide covers these traps in full.
Risk Management for Breakout Trades
Breakout strategies work through asymmetry: small frequent losses offset by occasional large wins. That math only holds if position sizing prevents any single loss from being catastrophic.
Risk-Based Position Sizing
Size each trade based on the distance from entry to stoploss, not as a fixed percentage of portfolio value:
Position size = (Account × Risk%) / (Entry price − Stoploss price)
If you risk 1% of a $10,000 account with a $200 stoploss distance, you size to $50 of maximum loss per trade. This keeps losses consistent regardless of whether price is volatile or calm at the time of entry. The position sizing guide covers this in detail with worked examples.
Confirmation Candle Requirement
One of the simplest false-breakout filters: instead of entering on the breakout candle itself, wait for the next candle to open above the breakout level. This avoids many intra-candle spikes that reverse before the bar closes. You sacrifice some entry quality in exchange for a significant reduction in fakeout trades.
In VolatiCloud's Strategy Builder, you can implement this by setting the condition to evaluate at candle open (the default trigger) and applying a persistence requirement — requiring the breakout condition to hold for a minimum number of consecutive bars before the entry fires.
More filters reduce fakeouts but also reduce valid signals. Backtest each filter individually to confirm it adds positive expectancy before layering them together. Over-filtering can turn a profitable strategy into one that rarely trades.
Adding Higher-Timeframe Context
Higher-timeframe trend alignment is the single most effective breakout filter. A 4-hour breakout succeeds far more often when the daily chart is in a defined uptrend. Adding this filter doesn't require a separate strategy — VolatiCloud supports multi-timeframe strategies through informative pairs, letting you pull daily indicators into a 4-hour strategy:
AND [
  Breakout conditions on 4H chart
  EMA(50) on daily chart is sloping upward   ← informative pair
]
The daily EMA acts as a regime filter — when the trend is up, breakouts are more likely to follow through. When the daily trend is flat or down, the strategy stays out even if the 4-hour signal fires.
From Backtest to Live Trading
Once your breakout strategy passes out-of-sample testing, the path to automation is straightforward:
- Paper trade first — Run the strategy as a paper-trade bot for 4–8 weeks to confirm live market behavior matches backtest expectations. The paper trading guide explains how to interpret paper trading results before going live.
- Start small — Allocate a fraction of your intended capital for the first 30–60 days. Scale up as the strategy proves itself.
- Set alerts — Configure VolatiCloud's alert system to notify you of unusual drawdowns or execution errors — so you're informed without needing to watch charts.
- Monitor in real time — VolatiCloud's live monitoring shows open positions, recent trades, and equity curve as they update.
Pairing a breakout bot with a complementary strategy (a mean-reverter, for example) is also worth considering. See the multi-bot portfolio guide for how to combine strategies that thrive in different regimes — breakout systems are best in expansion phases, and a paired mean-reverter covers the consolidation phases that breakouts hate.
Start Building Your Breakout Bot
Breakout strategies capture the moves that define a portfolio's long-term performance. Most of the market's largest gains (and losses) happen during these expansion phases — a systematic approach ensures you're positioned for them rather than reacting after they've already moved.
VolatiCloud's Strategy Builder provides the indicator library, logic system, and backtesting engine to build and validate breakout strategies without writing code. Combine that with the data lake's deep historical coverage and the multi-timeframe informative pairs system, and you have everything needed to develop a production-ready breakout bot.
Open the Strategy Builder in VolatiCloud and start building your first breakout strategy — initial backtests are free, and the Strategy Builder is included on all plans.