Ichimoku Cloud Strategy: Trend and Momentum for Crypto Bots

Most indicators answer one question — RSI asks "overbought or oversold," ATR asks "how much room does this trade need." Ichimoku Cloud tries to answer four at once: trend direction, trend strength, momentum, and where support or resistance will sit before price gets there. That last part is the strange one — the cloud on your chart is drawn ahead of the current candle, built from price that already happened. It looks like a forecast. It isn't one. Understanding what it actually is turns Ichimoku from an intimidating wall of lines into one of the more disciplined trend systems you can automate.
What Ichimoku Actually Computes
"Ichimoku Kinko Hyo" translates roughly to "one-glance equilibrium chart" — the idea is that a trader should be able to read trend, momentum, and support/resistance from a single view without cross-referencing separate indicators. It does that with four lines built entirely from price highs and lows, no closing-price averages involved:
| Line | Formula | Default period |
|---|---|---|
| Tenkan-sen (Conversion) | (highest high + lowest low) / 2, over the conversion window | 9 |
| Kijun-sen (Base) | (highest high + lowest low) / 2, over the base window | 26 |
| Senkou Span A (Leading Span A) | (Tenkan + Kijun) / 2, shifted forward by the base period | 26 |
| Senkou Span B (Leading Span B) | (highest high + lowest low) / 2 over the span window, shifted forward by the base period | 52 |
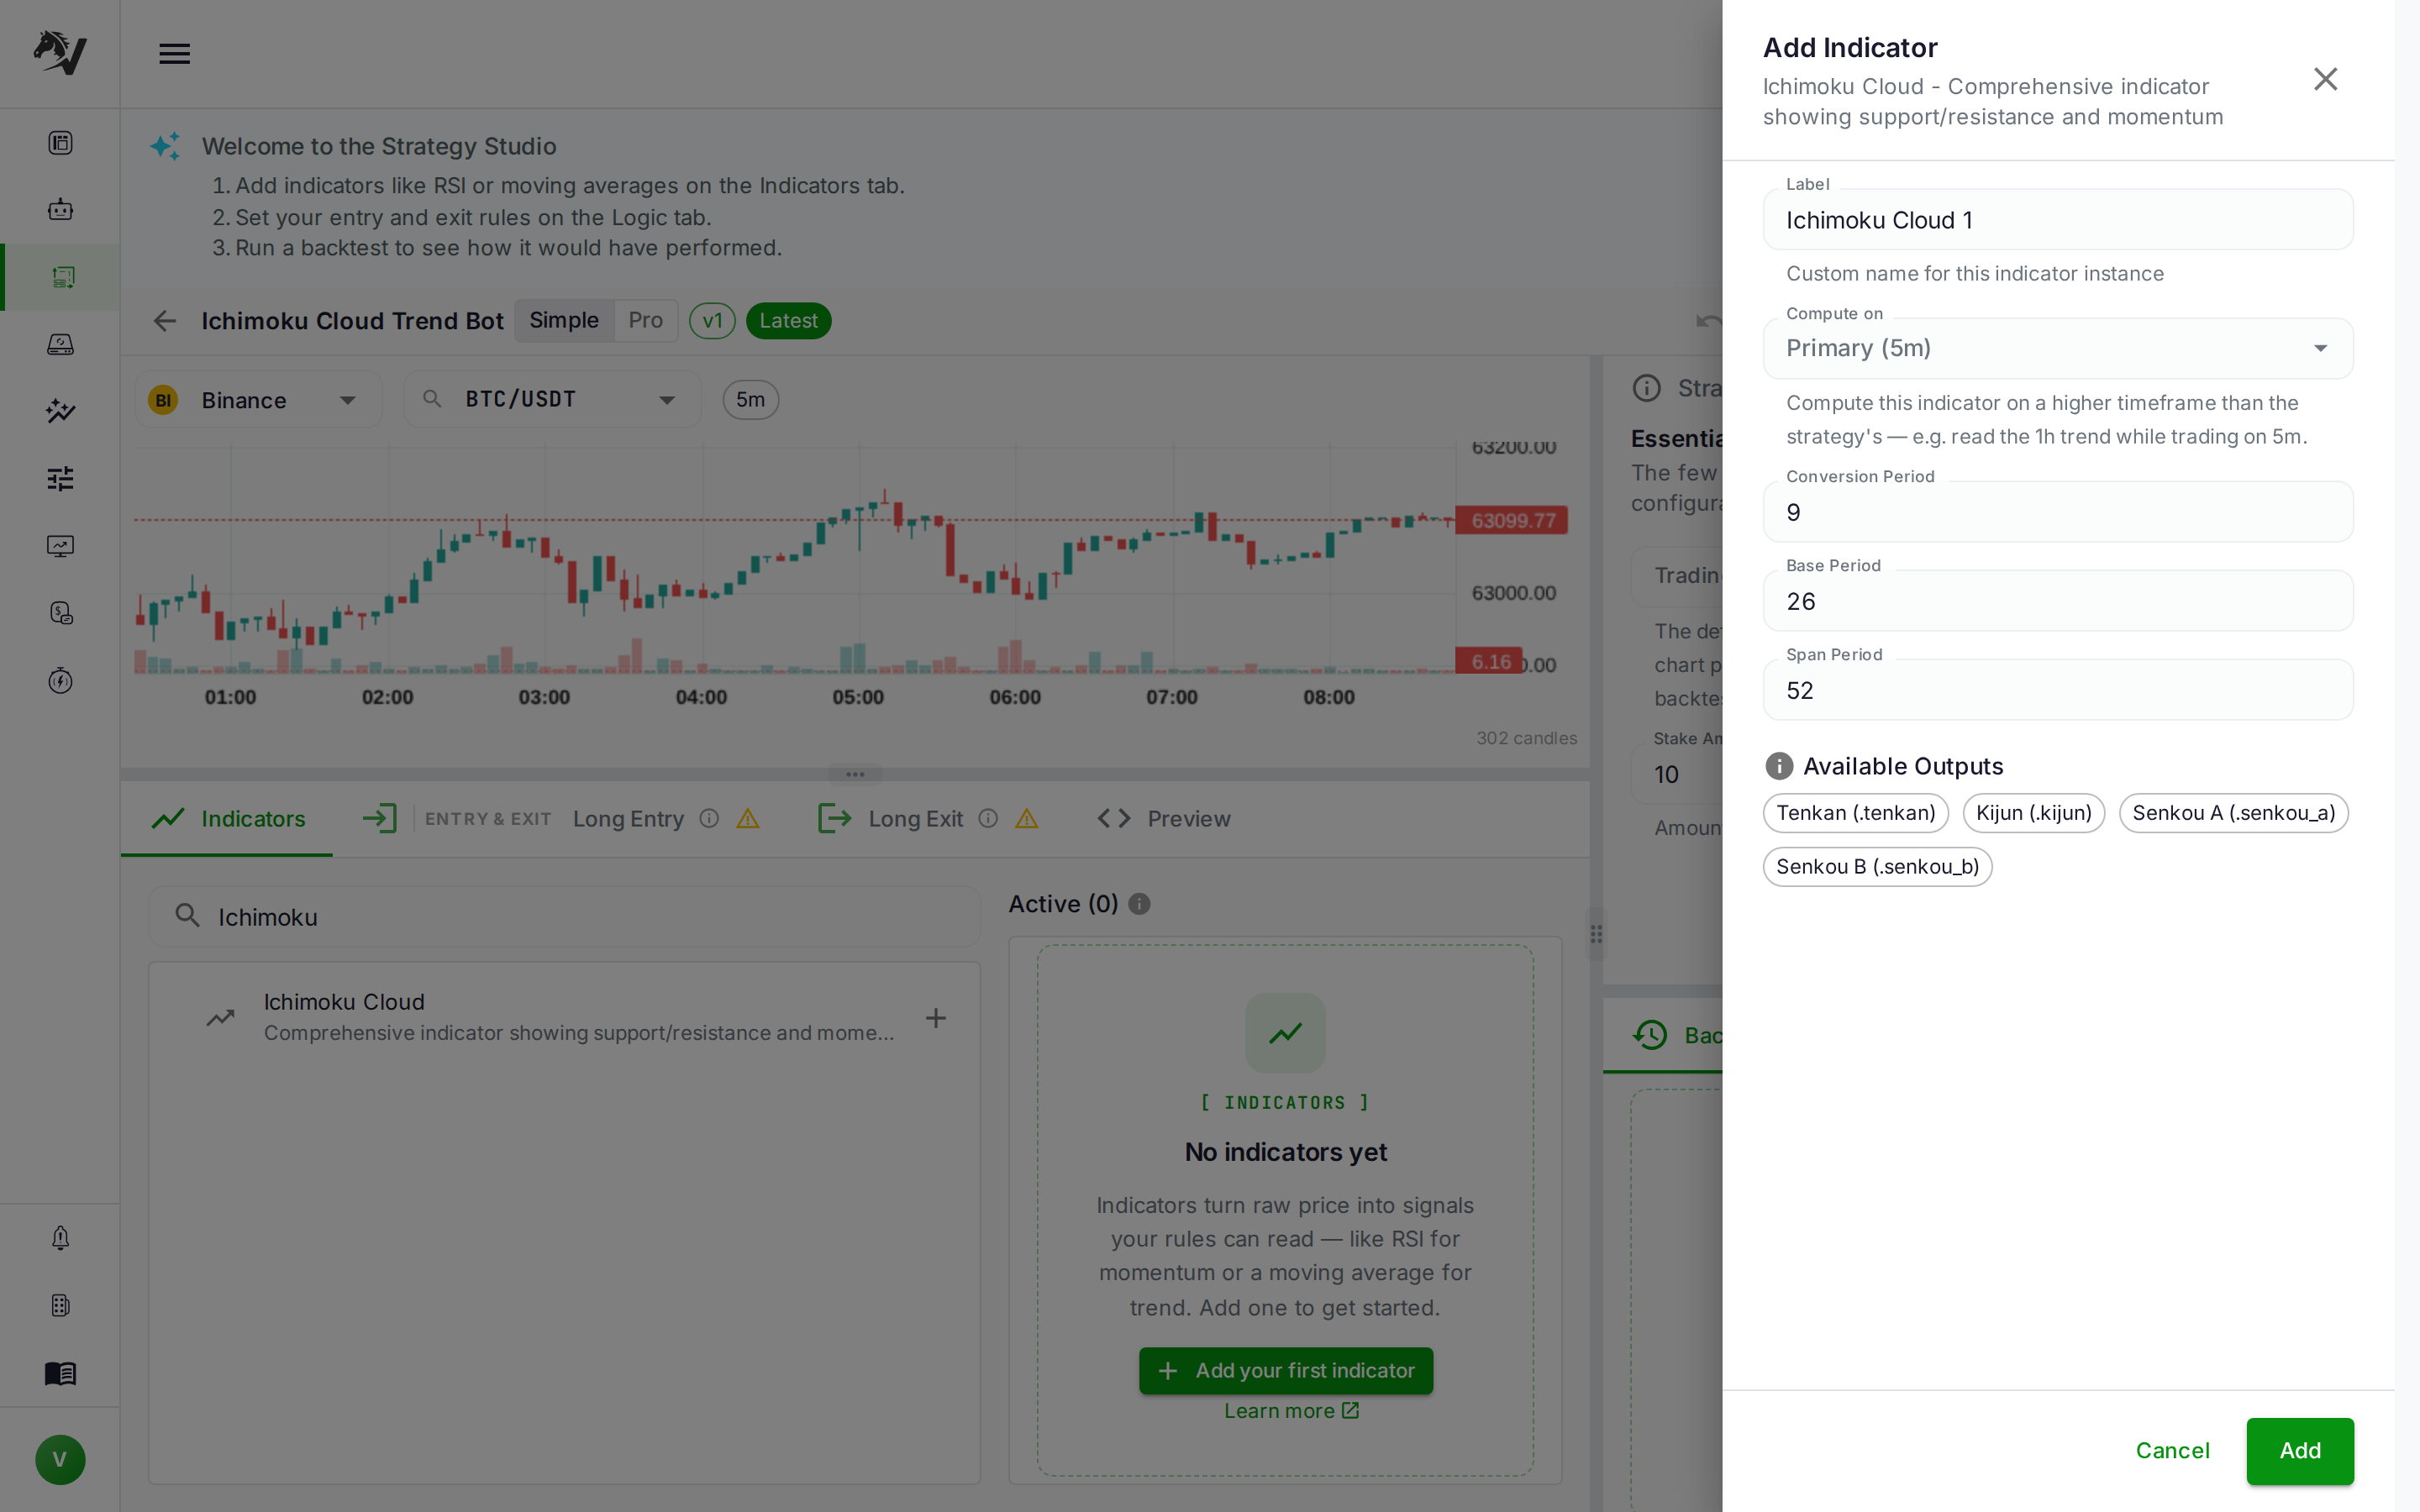
The space between Senkou Span A and Senkou Span B is the Kumo — the cloud. Classic Ichimoku charting also plots a fifth line, the Chikou Span (current close shifted backward), used as a visual confirmation tool rather than an input to mechanical rules. VolatiCloud's ICHIMOKU indicator node computes the four lines that entry and exit logic actually reference — Tenkan, Kijun, Senkou A, and Senkou B — available as .tenkan, .kijun, .senkou_a, and .senkou_b outputs on the indicator.
Why the Cloud Sits Ahead of Price
The forward shift is the part that trips people up. Senkou Span A and B are calculated from past highs and lows, then plotted base periods (26, by default) into the future. That's not a prediction of where price will go — it's a projection of where a support/resistance zone computed from recent price structure will physically sit on the chart, drawn early so you can see it coming.
Practically, this means the cloud edge visible above today's candle was computed from data that's already 26 periods old. There's no lookahead bias in a backtest — the value was knowable at the time it was plotted — but it does mean the cloud reacts slowly to genuinely new price action. A sharp reversal today won't reshape the cloud you're looking at for another 26 candles. That lag is a known tradeoff, not a bug: Ichimoku is built to smooth out noise, and smoothing always costs reaction speed. It's the same tradeoff covered in our walk-forward optimization guide — a slower-reacting filter avoids overfitting to yesterday's candle, but never expect it to catch the exact top or bottom.
Reading the Cloud
Three things to check at a glance, in order of importance:
- Price vs. cloud — price trading above the Kumo signals an uptrend bias; below it, a downtrend bias; inside it, no trend — treat it as chop.
- Cloud color (Span A vs. Span B) — when Senkou A sits above Senkou B, the cloud is typically shaded bullish (green); when B sits above A, bearish (red). A "twist" where the two spans cross marks a probable shift in the underlying trend, 26 periods before it shows up in price.
- Cloud thickness — a thick cloud represents a wide historical trading range and acts as a stronger support/resistance zone; price punches through a thin cloud far more easily than a thick one.
A common mistake is treating the cloud purely as a stop-loss line. It's closer to a zone of contested control — price chopping inside a thick cloud isn't giving you a clean signal either direction, and that's useful information on its own: it tells you to wait.
Three Ichimoku Signal Families
1. TK Cross (Tenkan/Kijun crossover)
The fastest, noisiest signal: Tenkan crossing above Kijun is bullish momentum, below is bearish. On its own it behaves like a fast/slow moving-average crossover — similar in spirit to the setups in our EMA crossover guide — and it's prone to the same whipsaws in a ranging market.
Long Entry: CROSSOVER(tenkan, kijun, direction=above)
2. Price-vs-Cloud breakout
Price closing above (or below) the Kumo confirms a directional trend has taken hold — slower to trigger than the TK cross, but far less prone to false starts, since it requires price to clear an entire support/resistance zone, not just cross a single line.
Long Entry: CROSSOVER(close, senkou_a, direction=above) AND close > senkou_b
3. Combined confirmation
Most durable Ichimoku strategies require the TK cross and a cloud position filter to agree, trading the TK cross's speed but only when the cloud confirms the broader trend is already established:
Long Entry: CROSSOVER(tenkan, kijun, above) AND close > senkou_a AND close > senkou_b
Building an Ichimoku Strategy in VolatiCloud
-
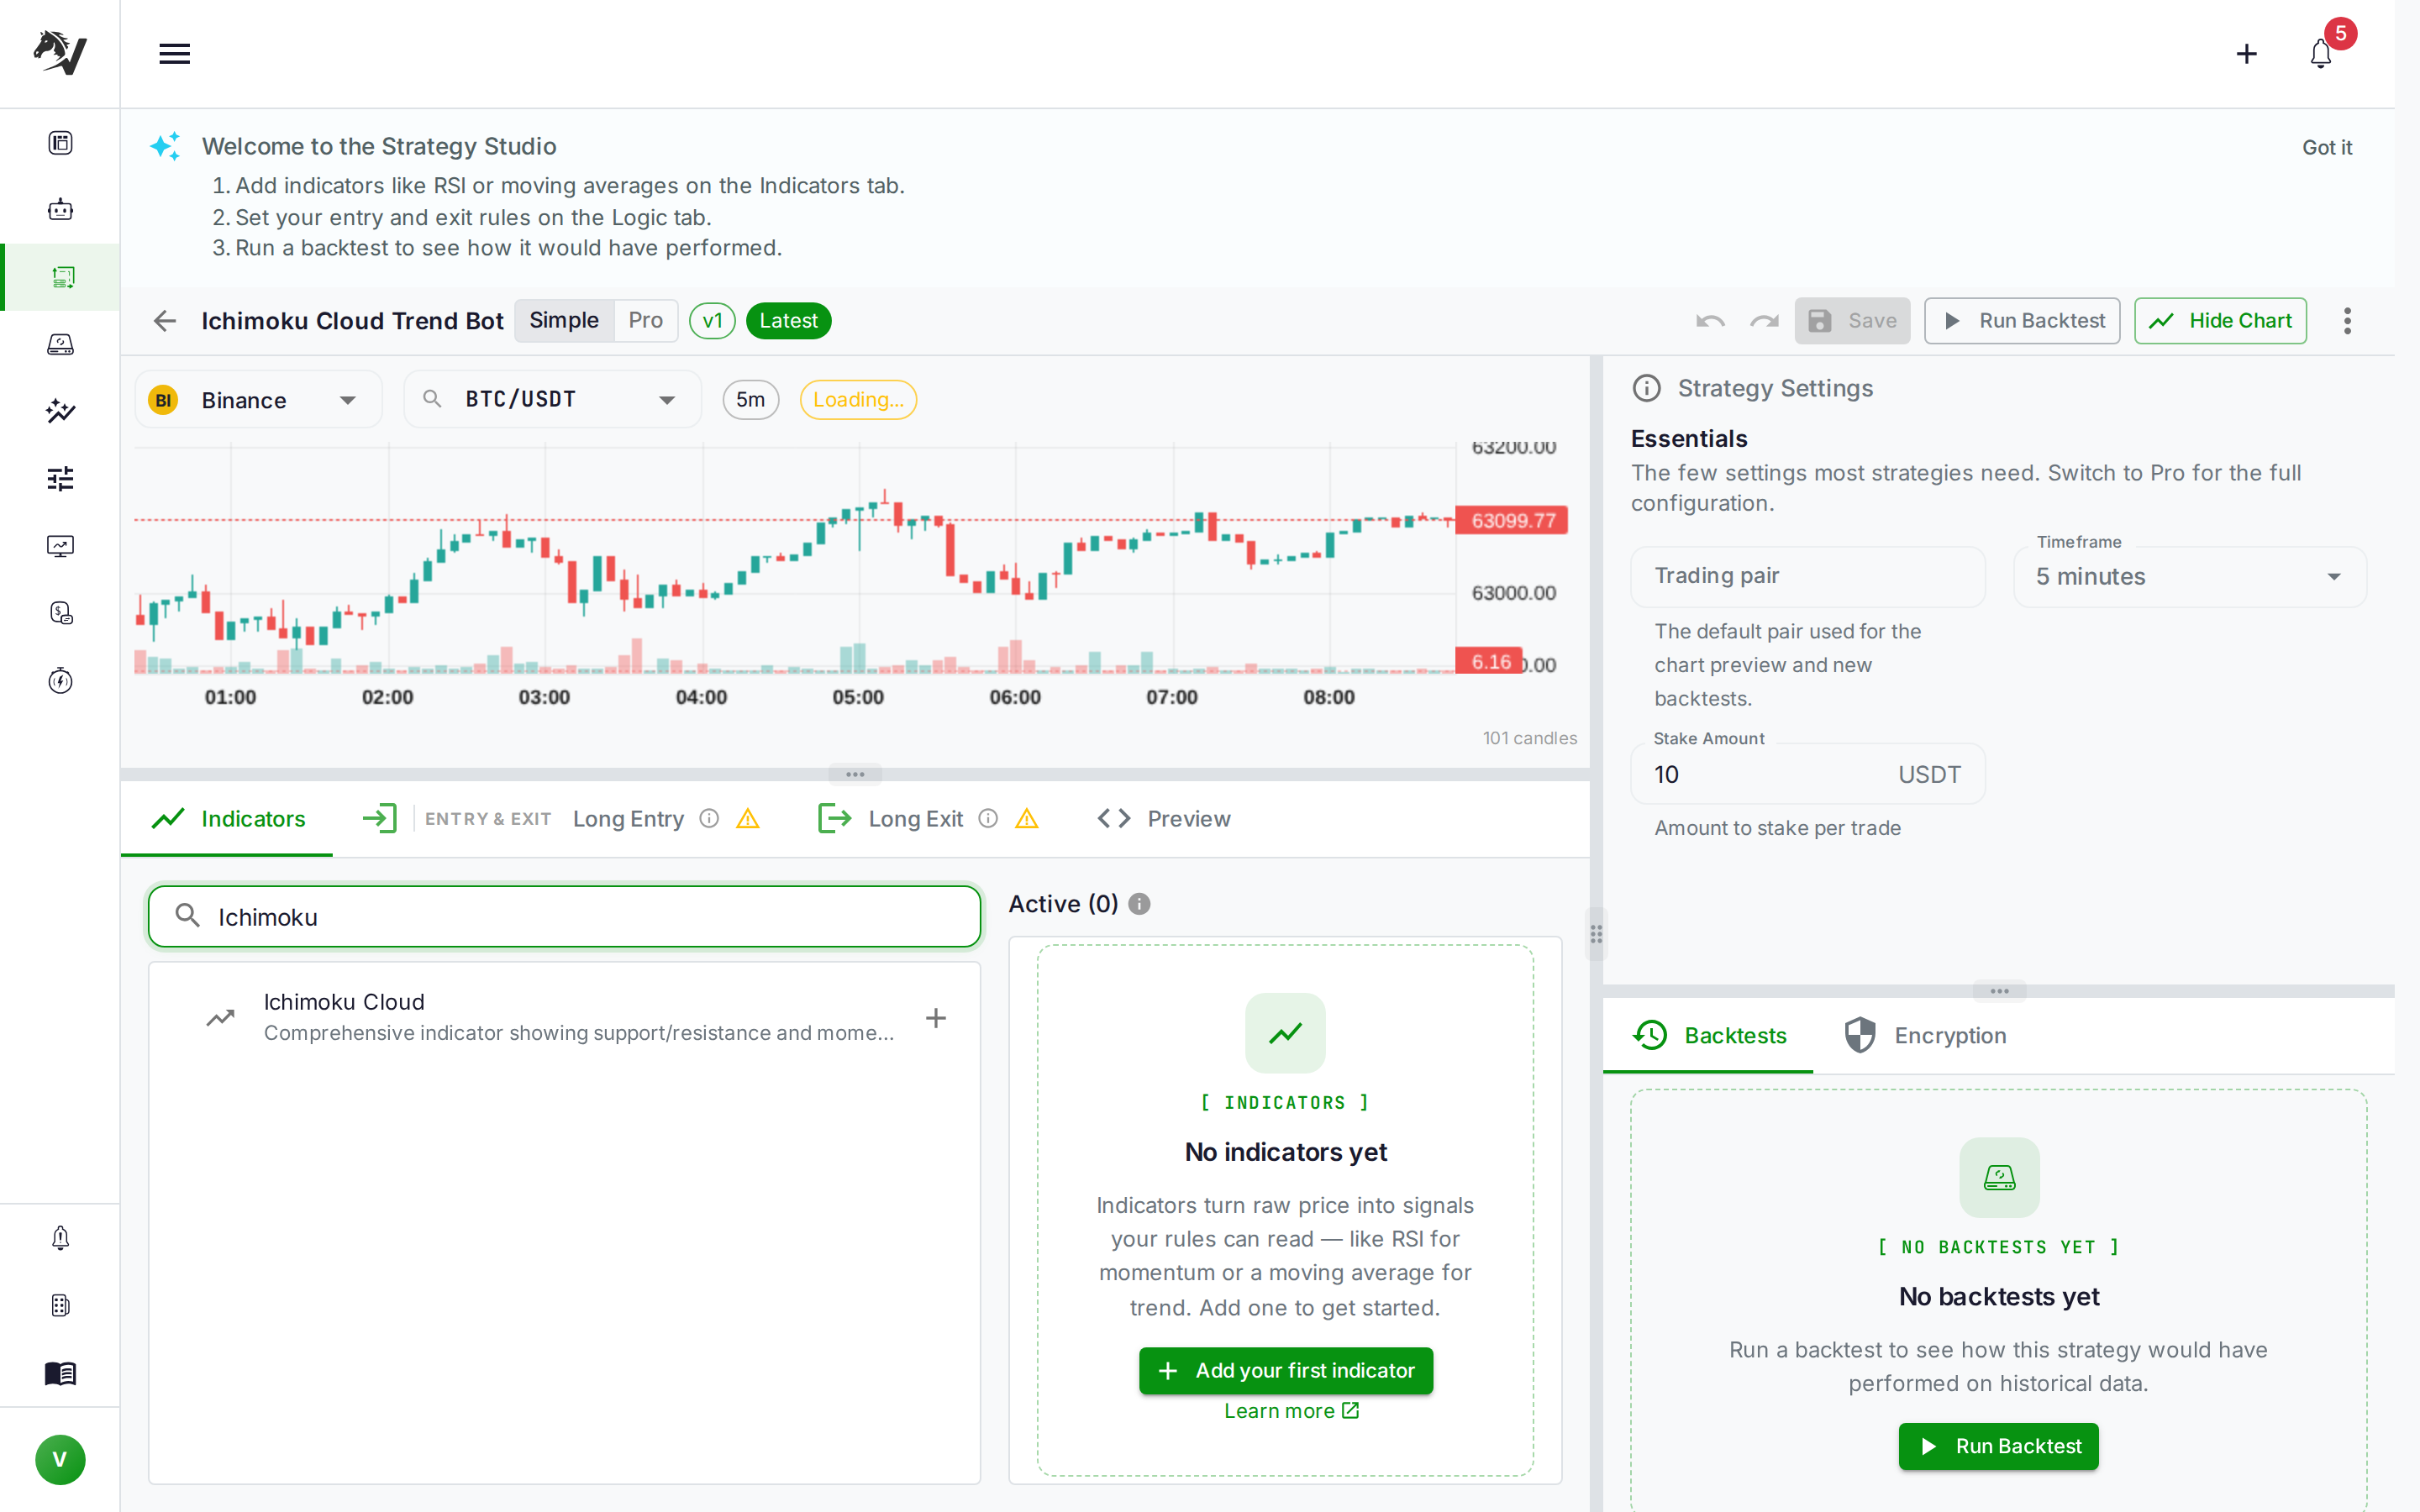
Open the Strategy Builder and create a new strategy. Search the indicator library for "Ichimoku" and add the Ichimoku Cloud node — it lives in the trend category alongside EMA, SMA, and ADX.
-
Set Conversion Period (Tenkan, default 9), Base Period (Kijun, default 26), and Span Period (Senkou B, default 52). These three defaults are the values almost all published Ichimoku track records are based on — changing them meaningfully changes the system, so treat a different parameter set as a strategy to validate from scratch, not a minor tweak.
-
In the Logic tab, build the long entry condition as an
ANDnode combining aCROSSOVER(Tenkan over Kijun) with twoCOMPAREconditions checkingcloseagainst.senkou_aand.senkou_b. No Python required in UI Builder mode — the generated Freqtrade strategy computes all four lines fromdataframe['high']anddataframe['low']under the hood. -
Mirror the same structure for exits: TK cross the other direction, or a close back inside/below the cloud. If you trade both directions, pair this with Mirror Mode instead of hand-authoring separate short logic.
Timeframe Matters More Than Usual
Ichimoku's default periods (9/26/52) were designed for daily candles on the Tokyo Stock Exchange, where 26 approximated a trading month. Crypto markets trade 24/7 with no such calendar rhythm, and on a 5-minute chart a 52-period span window covers under 4.5 hours — short enough that the cloud reacts to intraday noise rather than structural trend. Two practical fixes:
- Trade higher timeframes. 4-hour and daily charts are where the default parameters behave closest to their original design intent.
- Use it as a higher-timeframe filter. Compute Ichimoku on the daily chart while executing entries on a faster timeframe — the same multi-timeframe pattern used for EMA trend filters, just applied to the cloud position instead of a moving average.
Filtering Out the Inside-the-Cloud Chop
Price spends a meaningful fraction of time inside the Kumo, especially on lower timeframes, and every signal generated there is low-confidence by definition — the cloud itself is telling you there's no established trend. Adding an ADX filter on top of the price-vs-cloud check screens these periods out the same way it sharpens a Supertrend or a regime-detection system:
Long Entry: CROSSOVER(tenkan, kijun, above) AND close > senkou_a AND close > senkou_b AND ADX(14) > 25
This mirrors the ADX-gate pattern from our market regime detection guide — trend direction and cloud position tell you which way, ADX tells you whether it's worth trading at all.
Backtesting Notes
Ichimoku's 52-period Senkou B window means the indicator needs meaningfully more warm-up candles than RSI or a short EMA before its outputs stabilize — make sure your backtest date range starts well before your intended analysis window, or the first weeks of results will be built on an incomplete cloud. Beyond that, treat it like any trend system: run it through hyperopt across a conservative range (conversion 7–12, base 20–30, span 44–60) rather than a wide search that will happily curve-fit noise, and validate the winning parameter set out-of-sample before deploying live. Our how-to-read-a-backtest guide covers which metrics tell you the difference between a real edge and a lucky parameter set.
Ichimoku vs. Other Trend Filters
| Ichimoku Cloud | EMA Crossover | Supertrend | |
|---|---|---|---|
| Inputs | High/low ranges, no closes | Closing price averages | ATR-scaled bands |
| Signal speed | Slow (26-period base lag) | Configurable, typically medium | Fast, flips on every close-through |
| Built-in support/resistance | Yes — the cloud itself | No | Yes — the band itself |
| Best timeframe | 4h and above | Any, with a slower confirming MA | Any, paired with ADX |
| Signal types available | Three (TK cross, breakout, combined) | One (crossover) | One (flip) |
Ichimoku's edge is breadth — one node gives you a trend filter, a momentum signal, and a support/resistance zone instead of three separate indicators. The cost is complexity: more parameters to understand, more lag to accept, and a steeper learning curve before the signals make intuitive sense on a chart.
Get Started
Add an Ichimoku Cloud node to a new strategy in the VolatiCloud console, start with the 9/26/52 defaults on a 4-hour or daily timeframe, and backtest the combined TK-cross-plus-cloud-filter entry before touching hyperopt. If you're already running a different trend filter, it's worth backtesting Ichimoku as a side-by-side comparison rather than stacking both — see the EMA crossover guide for the counterpart system to compare it against.