Parabolic SAR Strategy: Trailing Stops and Reversals for Crypto Bots

Most indicators do one job — RSI measures momentum, ATR measures volatility, ADX measures trend strength. Parabolic SAR does two at once: it generates entry/exit signals when its dots flip sides, and while a trend is intact, those same dots trail behind price as an accelerating stop-loss. J. Welles Wilder — the same analyst behind RSI and ATR — designed it to answer one question: "if I'm in this trade, where's the level that says I'm wrong?"
What SAR Actually Plots
SAR stands for Stop And Reverse. Instead of a line following price, it plots a series of dots that sit on one side of the candles — below price during an uptrend, above price during a downtrend. When price crosses through the dot, SAR flips to the other side, and that flip is both an exit signal for the current position and an entry signal for the opposite one.
The dots aren't evenly spaced. Each new SAR value is calculated from the prior SAR, the trend's extreme point (EP — the highest high in an uptrend or lowest low in a downtrend), and an acceleration factor (AF) that increases every time a new extreme point is set:
SAR(next) = SAR(current) + AF × (EP − SAR(current))
AF starts small (default 0.02) and increases by the same step (default 0.02) each time price sets a fresh extreme, up to a cap (default 0.2). The practical effect: SAR trails loosely at the start of a trend, when a pullback shouldn't stop you out, and hugs price more tightly the longer the trend runs — accelerating toward price exactly as the trend becomes more mature and more likely to end. That's where the "parabolic" name comes from: plotted over time, the dots trace a curve that bends increasingly steeply toward the price line.
SAR as Entry Signal and Trailing Stop — At the Same Time
This dual role is what makes SAR different from most indicators in the VolatiCloud indicator library:
- As a trend-following trigger, a flip from above-price to below-price is a long entry; a flip from below to above is a short entry (or an exit if you're not running mirror mode).
- As a trailing stop, the current dot position is your stop-loss level for as long as the trend continues — no separate stop calculation required.
That second point is the real value proposition. Our ATR stop-loss guide covers a volatility-adjusted stop that's a fixed multiple of ATR away from price — it widens and narrows with volatility, but the distance from price doesn't otherwise change over the life of a trade. SAR's stop distance shrinks specifically as the trend ages, which is a different bet: it says a trend that's run longer deserves a tighter leash, independent of whether volatility itself has changed.
| Parabolic SAR | ATR-based stop | |
|---|---|---|
| Distance from price | Shrinks as the trend matures (accelerating) | Proportional to recent volatility, roughly constant per trade |
| Reacts to | Time-in-trend / consecutive new extremes | Volatility expansion/contraction |
| Doubles as an entry signal | Yes — the flip itself | No — needs a separate trigger |
| Best fit | Strong, sustained trends | Any trade needing a volatility-aware stop, trending or not |
They aren't mutually exclusive. A common pattern is to use SAR for the trailing stop and a separate indicator (EMA crossover, Supertrend) for the entry trigger, so a strong signal isn't discarded just because SAR itself hasn't flipped yet.
Building a SAR Strategy in VolatiCloud
1. Add the SAR node
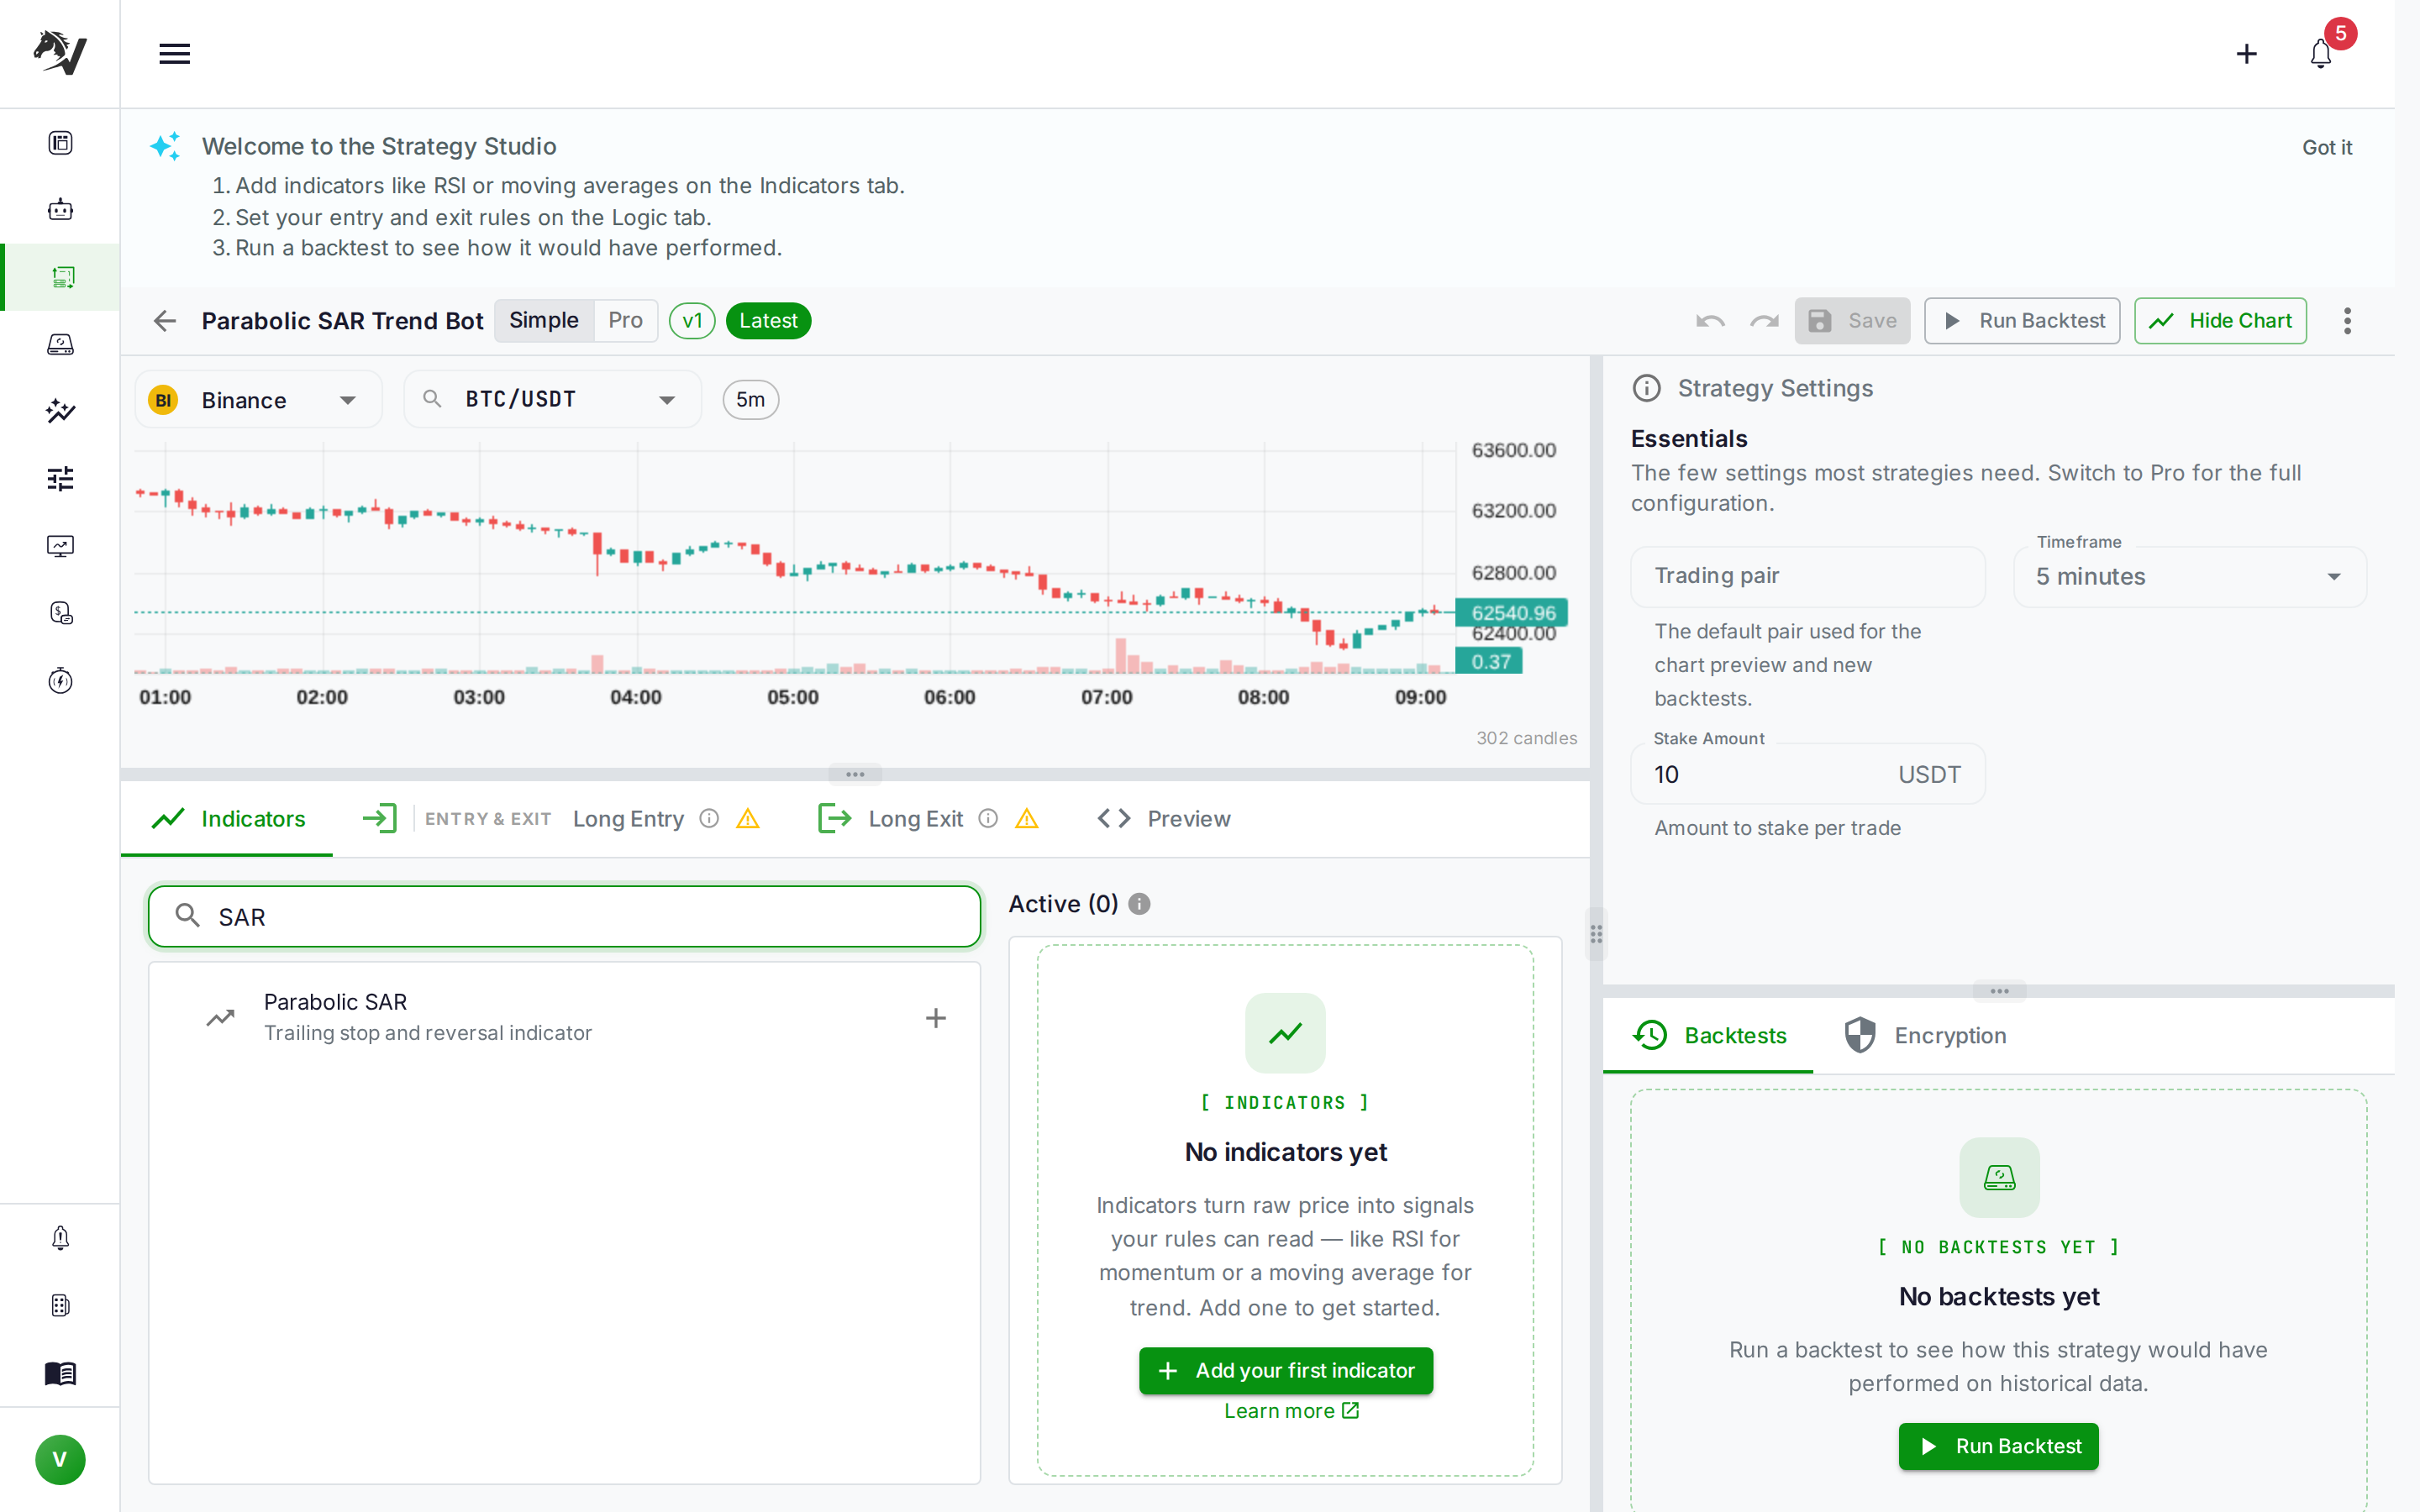
Open the Strategy Builder, search the indicator library for "SAR," and add the Parabolic SAR node to the canvas. It lives in the trend category alongside EMA, Supertrend, and Ichimoku. Three parameters control its behavior:
Start AF— the initial acceleration factor (default0.02)Increment AF— how much AF grows per new extreme point (default0.02)Max AF— the acceleration cap (default0.2)
2. Trigger entries on a flip
SAR flips are naturally expressed as a CROSSOVER condition between price and the SAR line:
Long Entry:  CROSSOVER(close, sar, direction=above)
Short Entry: CROSSOVER(close, sar, direction=below)
In the Logic tab, this is a single CROSSOVER node comparing the close price operand against the SAR indicator operand — no custom Python needed in UI Builder mode.
3. Use SAR as your stoploss reference, not Freqtrade's static stoploss
A pure flip-to-flip strategy exits and re-enters on every reversal, which is exactly what a trailing-stop design wants — but if you're layering SAR onto a different entry trigger (say, an EMA crossover for entries with SAR managing the exit), express the exit as its own condition rather than relying on a single fixed stoploss value:
Long Exit: CROSSOVER(close, sar, direction=below)
This lets the exit level move with SAR's accelerating curve instead of sitting at one static percentage for the whole trade.
4. Filter out chop with a trend-strength gate
SAR's biggest weakness is ranging markets. In a range, price crosses back and forth across the SAR dots repeatedly, generating a flip — and a trade — on almost every swing, with the acceleration factor resetting to its minimum each time before it ever gets a chance to tighten. Pair SAR with a regime or trend-strength filter so it only trades when there's a real trend to trail:
Long Entry: CROSSOVER(close, sar, direction=above) AND ADX(14) > 25
See our ADX indicator guide for the mechanics of that filter, or the broader market regime detection approach if you want a more general trending-vs-ranging classifier feeding multiple strategies.
Tuning the Acceleration Factor for Crypto
Wilder built SAR for daily commodity charts. Crypto's shorter, noisier timeframes (5m–1h) often whipsaw a default-tuned SAR far more than a daily chart would, for two compounding reasons: candles are noisier relative to the size of the trend, and the default 0.02 starting AF is tight enough that a single sharp wick can trigger a premature flip.
| Adjustment | Effect | When to use it |
|---|---|---|
Raise Start AF (e.g. 0.03–0.05) | Stop trails tighter from the very first candle of a new trend | Fast timeframes where you want quicker acknowledgment of a reversal |
Lower Start AF (e.g. 0.01) | Stop gives the trend more room early on | Choppier pairs where early pullbacks are common but not fatal to the trend |
Lower Max AF (e.g. 0.1–0.15) | Stop never tightens as aggressively, even in a long-running trend | Assets that trend for a long time with frequent shallow pullbacks (BTC majors more than altcoins) |
Raise Increment AF | Stop accelerates faster once a trend is confirmed | Strategies that want to lock in profit quickly once a move is underway |
Don't guess at these — run hyperopt across a grid of Start AF / Max AF combinations and validate the winner on an out-of-sample date range, the same discipline covered in our walk-forward optimization guide. A parameter set that looks great over one trending quarter can lose most of its edge back to whipsaw the next time the pair spends a month ranging.
Backtest SAR-only entries and SAR-as-exit-only separately before combining them with another trigger. It's the only way to tell whether SAR's entries or SAR's stop management is doing the work — mixing both changes at once makes the comparison meaningless.
Why a Self-Trailing Stop Is Different From a Fixed One
A fixed-percentage trailing stop — say 3% below the highest close since entry — moves toward price at a constant rate, whatever the trend is doing. SAR moves toward price at a rate that depends on the trend's own behaviour:
- Fresh trend, few new extremes —
AFis still near its starting value, the dots trail loosely, giving a new trend room to establish itself without being stopped out on the first pullback. - Extended trend, repeated new extremes —
AFhas climbed toward its cap, the dots trail tightly, locking in more of the accumulated gain as the move matures.
That is the opposite failure mode from a naive fixed stop, which is either too tight early (stopping out trends before they start) or too loose late (giving back a large chunk of an extended move). SAR's acceleration curve tries to solve both with one formula, trading the simplicity of a fixed percentage for a stop that adapts to trend maturity rather than just distance travelled.
Parabolic SAR vs. Supertrend: Two Trailing-Stop Philosophies
Both indicators answer "where is my trailing stop," and VolatiCloud ships both as native Strategy Builder nodes — but they compute the answer differently:
| Parabolic SAR | Supertrend | |
|---|---|---|
| Signal basis | Acceleration factor climbing toward a cap as new extremes form | ATR-scaled bands around the midpoint price |
| Reacts to | Price touching the dot | A close crossing the ATR band |
| Trail speed | Increases with trend duration and extremity | Increases with volatility, constant otherwise |
| Best regime | Strong, sustained directional moves | Both trending and choppier-but-volatile markets |
| Whipsaw behaviour | Frequent flips in sideways chop — every minor swing counts as a new extreme | Frequent flips in low-ADX chop |
If your Supertrend strategy already covers ATR-adaptive trailing stops, backtest SAR as an alternative rather than stacking it on top. Running both on the same position usually just means the tighter of the two dominates your exit timing — you get the constraint of both and the benefit of neither.
What to Expect in a Backtest
A flip-to-flip SAR strategy on a trending pair typically shows a distinct shape in the results: fewer trades than a mean-reversion system, a lower win rate than you might expect from a "trend-following" label, and a profit factor that depends heavily on a small number of large winners offsetting a longer tail of small losses from failed flips. That's a normal trend-following signature, not a red flag — see how to read a backtest for which metrics (profit factor, average win/loss ratio) actually confirm the strategy is working versus which ones (raw win rate) will mislead you here.
Because every flip both closes the current position and opens the opposite one, a ranging market can generate a high trade count with a low win rate and grinding, incremental losses — the classic whipsaw pattern. If your backtest trade count looks unusually high relative to the date range, check the ADX or regime filter before assuming the strategy itself is broken.
Watch the flip count, not just the win rate. A strategy that flips 30+ times over a three-month window on a 15-minute timeframe pays spread and slippage on 30 round trips whether or not the underlying trend calls were right, so always model realistic fees and slippage — a chop-prone SAR system is far more fee-sensitive than a lower-frequency trend filter that flips a handful of times a quarter.
Search acceleration/maximum as a pair over a sensible hyperopt space — acceleration 0.01–0.05, maximum 0.1–0.3 — and validate the winner on an out-of-sample date range before deploying. A pair that only performed well because it happened to fit one strong six-month trend is a coincidence, not an edge; see avoiding overfitting for how to tell them apart.
Get Started
Add a Parabolic SAR node to a strategy in the VolatiCloud console, wire a CROSSOVER(close, sar) condition for entries or exits, and run a backtest before and after adding an ADX filter to see whether trend confirmation improves your specific pair and timeframe. If you're new to trailing-stop design generally, our position sizing and risk management guide covers how stop placement interacts with the rest of your risk budget.