Supertrend Strategy: An ATR-Based Trend Filter for Crypto Bots

Most trend-following indicators — moving average crossovers included — give you a signal but no obvious place to put your stop. Supertrend does both in one line: an ATR-based band that flips above or below price as the trend changes, doubling as an entry signal and a trailing stop that expands and contracts with volatility. It's one of the few indicators popular enough to have its own dedicated buttons on retail charting platforms, and it's built into VolatiCloud's indicator library as a native node.
What Supertrend Actually Computes
Supertrend is built from two ingredients: the midpoint price (high + low) / 2 and the Average True Range (ATR), which measures how much an asset typically moves per candle. From those it derives an upper band and a lower band:
Basic Upper Band = (High + Low) / 2 + (Multiplier × ATR)
Basic Lower Band = (High + Low) / 2 − (Multiplier × ATR)
The bands then "ratchet" — each new band can only move in the direction that tightens around price, never loosen — until price closes on the wrong side of the active band, at which point the indicator flips and starts trailing from the other side. The result plotted on a chart is a single line that sits below price in an uptrend (support) and above price in a downtrend (resistance), changing color at every flip.
That ratcheting behavior is the whole point: because the bands only tighten, Supertrend can't get shaken out by a single wide candle the way a fixed-percentage stop can, but it also can't ignore a strong reversal for long, because a close on the wrong side forces an immediate flip.
The two parameters that matter
| Parameter | Default | Effect |
|---|---|---|
period | 10 | ATR lookback. Shorter periods react faster to fresh volatility; longer periods smooth it out |
multiplier | 3.0 | How far the bands sit from price. Lower values flip more often (more signals, more noise); higher values flip less often (fewer signals, wider stops) |
In VolatiCloud's Strategy Builder these map directly to the Supertrend node's ATR Period and Multiplier fields — no code required to change either one.
A
period=10, multiplier=3Supertrend and aperiod=7, multiplier=2Supertrend are, in practice, two different strategies. Don't tune one and assume the other behaves the same way — walk-forward validate each parameter set independently.
Why ATR-Based Bands Beat a Fixed Trailing Stop
A fixed-percentage trailing stop (say, 2% below the highest high since entry) treats a calm market and a violent one identically. During a low-volatility grind, a 2% stop is too wide and gives back profit slowly on every pullback. During a volatility spike, the same 2% stop gets clipped by normal noise before the move even develops.
Supertrend's bands scale with ATR, so the stop distance adapts automatically:
- Quiet market — ATR is small, bands sit close to price, the stop tightens and locks in gains faster
- Volatile market — ATR is large, bands sit farther from price, the stop gives the trade room to breathe through normal swings
This is the same underlying principle covered in our ATR stop-loss strategy guide — Supertrend is essentially that ATR-adaptive stop logic packaged as a standalone trend indicator with its own entry signal built in, rather than something you bolt onto an existing entry rule.
Building a Supertrend Strategy in VolatiCloud
1. Add the Supertrend node
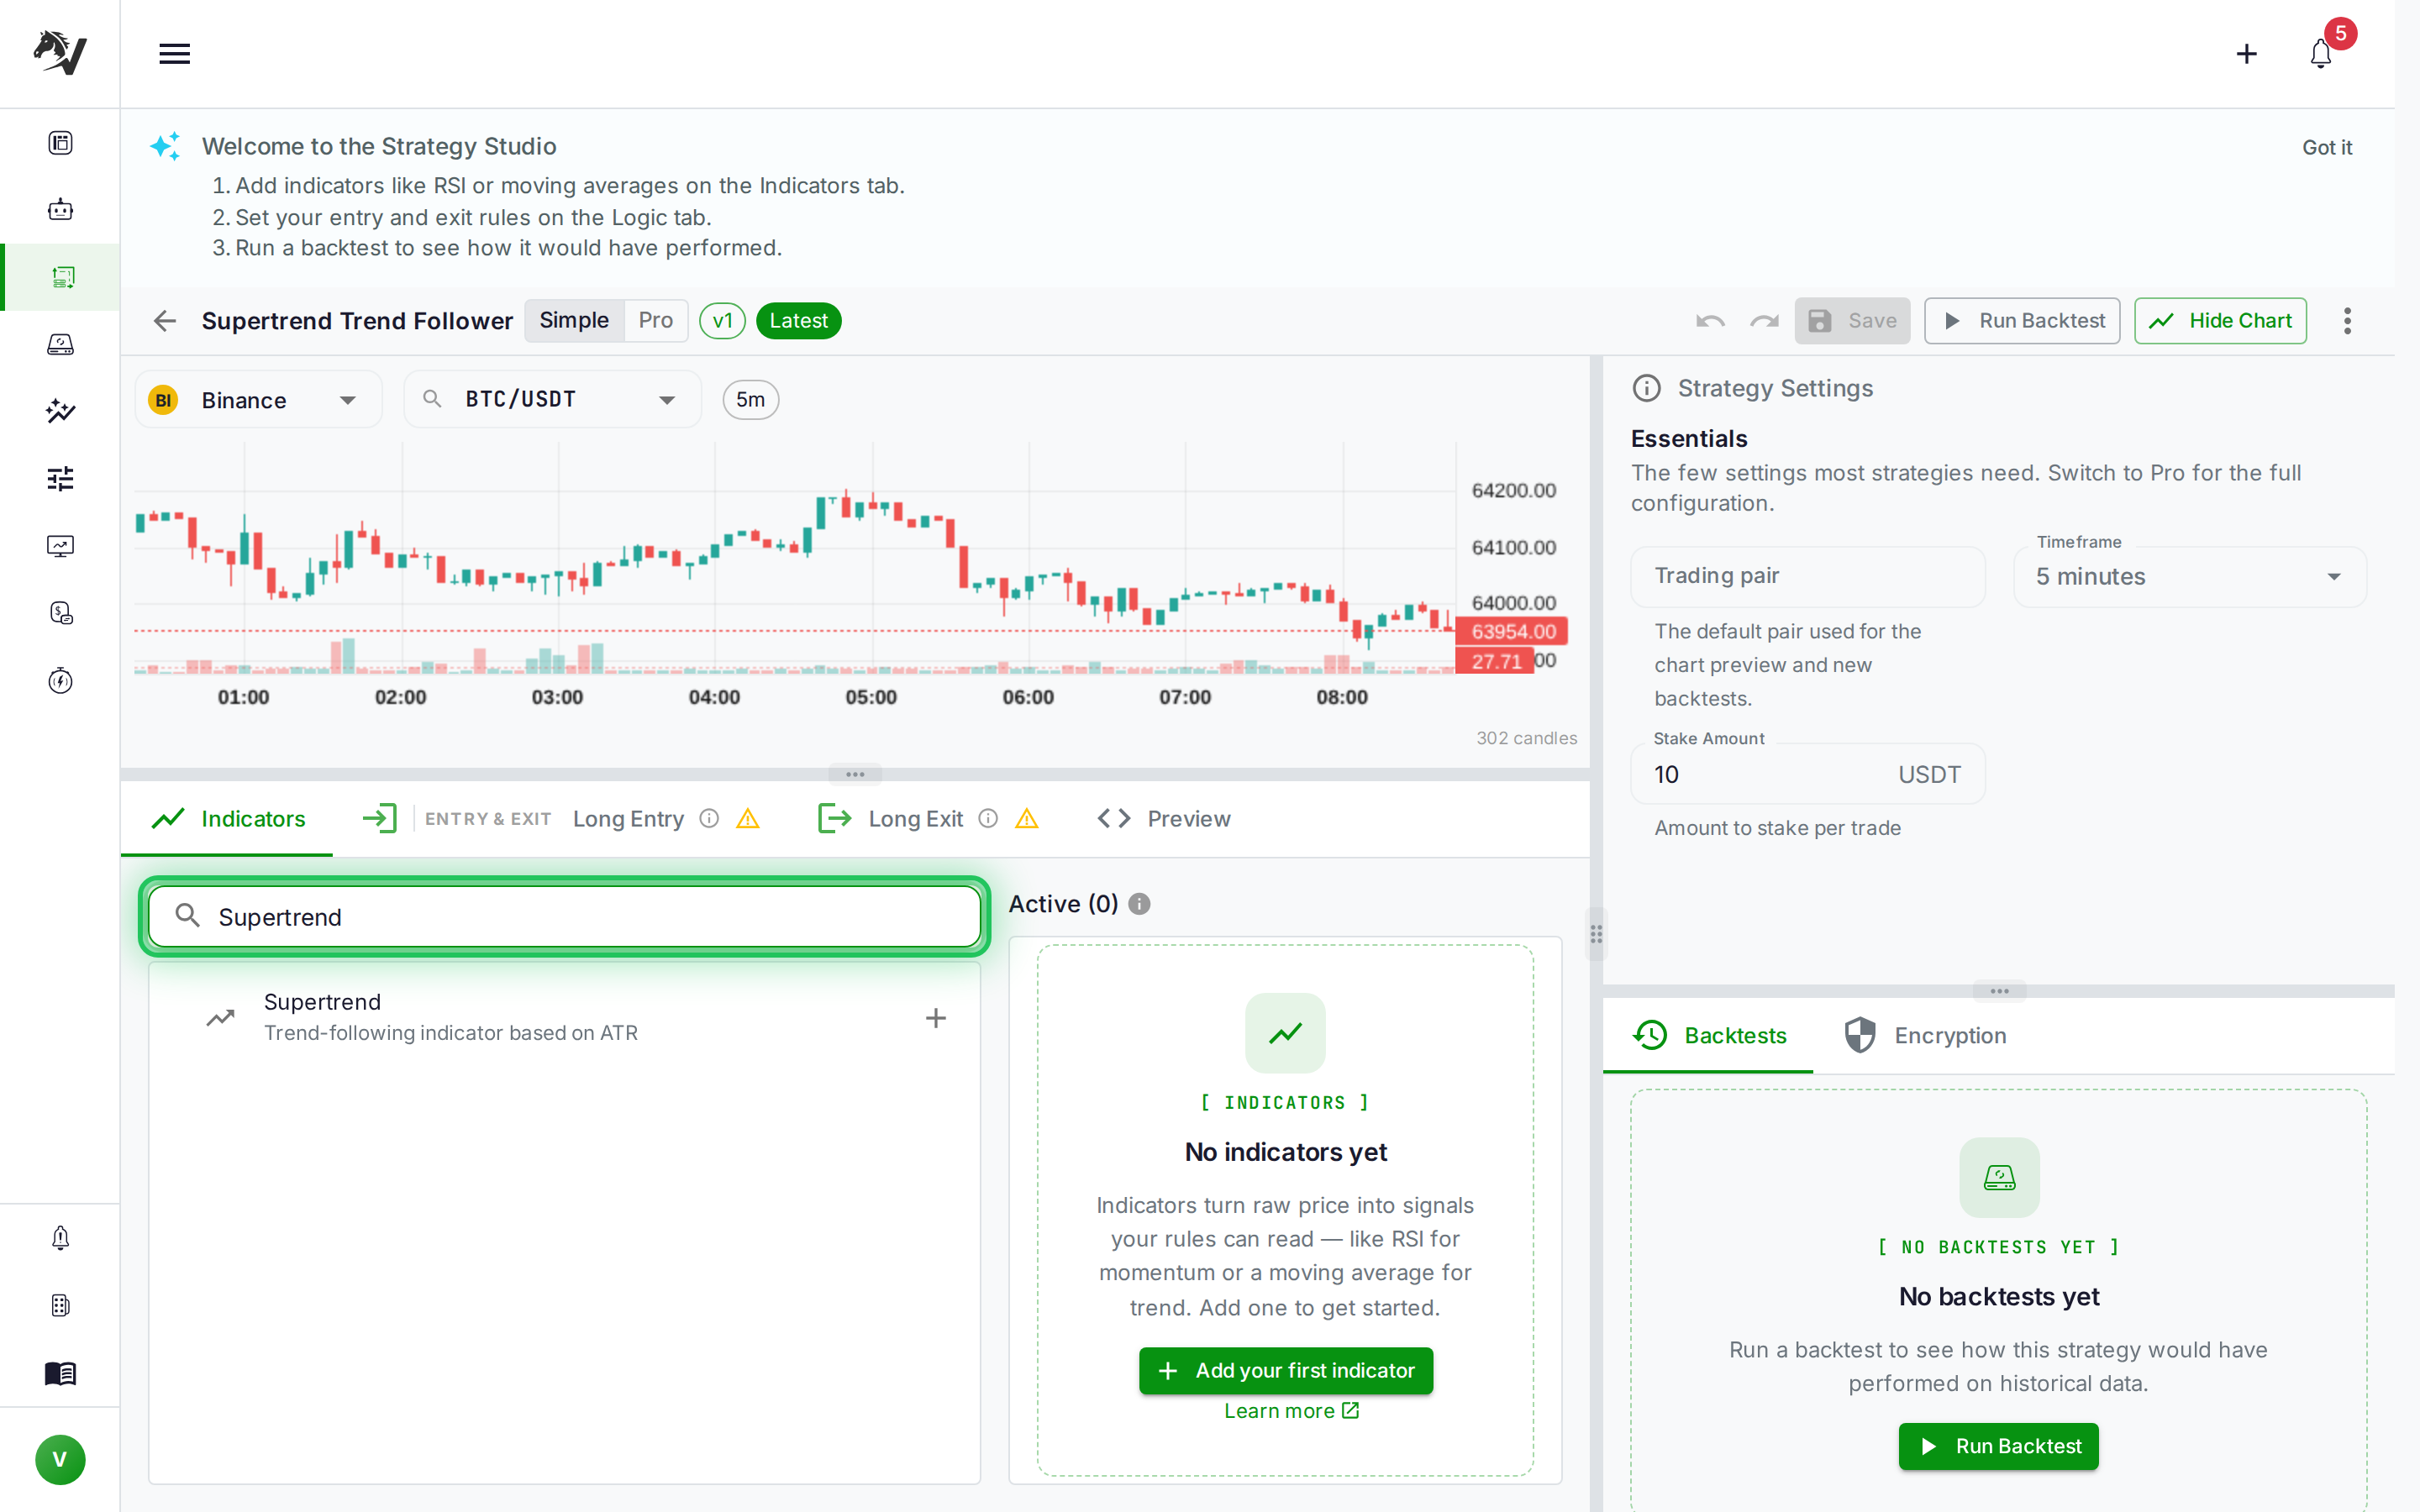
Open the Strategy Builder, search the indicator library for "Supertrend", and drag it onto the canvas. It lives in the trend category alongside EMA, SMA, and ADX. Set period and multiplier — start with the 10/3.0 defaults, since they're the values most backtested track records are based on.
2. Define entry logic
The canonical Supertrend entry rule is a flip crossover — enter long when price crosses above the Supertrend line (the band flips from resistance to support), enter short when price crosses below it:
Long Entry:  CROSSOVER(close, supertrend_line, direction=above)
Short Entry: CROSSOVER(close, supertrend_line, direction=below)
In the Strategy Builder's Logic tab, this is a single CROSSOVER condition node comparing the close price operand against the Supertrend output — no custom Python required in UI Builder mode. If your strategy trades both directions, pair it with Mirror Mode so the short leg inherits the same logic with signs flipped.
3. Use the flip as your exit — or don't
Because Supertrend is a stop-and-reverse system by construction, the simplest exit rule is "exit long when the line flips against you" — the same crossover condition, inverted, closes the position. That's a valid always-in-the-market system for a single asset, but for a portfolio of concurrent bots it usually pays to add a hard stoploss underneath as well, so a single asset's failed reversal can't consume more risk budget than the rest of the portfolio allows. See position sizing and risk management for how to size that stoploss relative to account equity rather than per-trade guesswork.
4. Combine with a trend-strength filter
Supertrend flips on every close-through, including in a choppy, range-bound market where price oscillates around the bands without committing to a direction — the classic whipsaw failure mode of every stop-and-reverse system. Filtering entries with ADX above a threshold (commonly 20–25) confirms the market actually has directional strength before Supertrend's flip is trusted as a signal:
Long Entry: CROSSOVER(close, supertrend_line, above) AND ADX(14) > 25
This combination — trend direction from Supertrend, trend strength from ADX — mirrors the regime-aware approach in our market regime detection guide: trade the trending regime with a trend system, and stand aside (or switch strategies) when ADX signals a range.
Backtesting Before You Trust the Flips
Supertrend's headline weakness is exactly what makes it attractive: it never sits still in chop. Every backtest should report flip frequency alongside the standard win rate and profit factor — a strategy that flips 40 times over a 3-month backtest window on a 5-minute timeframe is paying the spread and slippage on 40 round trips regardless of whether the flips were profitable. Run the backtest with realistic fees and slippage modeled in, not the exchange's advertised maker rate, since Supertrend's frequent re-entries are more fee-sensitive than a buy-and-hold trend filter that only trades a handful of times a year.
Once you have a candidate period/multiplier pair, run hyperopt across a reasonable range — period 7–21, multiplier 1.5–4.0 is a sane search space — and validate the winning combination on an out-of-sample date range before deploying it live. A parameter set that only worked because it happened to fit one particular six-month trend is not a strategy, it's a coincidence with an equity curve attached.
Supertrend vs. EMA Crossover: When to Use Which
Both are trend-following systems, but they fail differently:
| Supertrend | EMA Crossover | |
|---|---|---|
| Signal basis | Volatility-adjusted price bands | Two moving averages of price |
| Reacts to | A close crossing an ATR-scaled line | One average crossing another |
| Whipsaw behavior | Frequent flips in low-ADX chop | Frequent crosses in tight ranges |
| Built-in stop | Yes — the band itself | No — needs a separate stop rule |
| Best paired with | ADX trend-strength filter | 200-period trend filter (see our EMA guide) |
If you already run an EMA crossover bot, Supertrend is worth backtesting as a direct swap-in rather than an addition — running both on the same pair usually just doubles your correlated whipsaw risk instead of diversifying it. Treat them as two candidate trend filters to compare in backtests, not two indicators to stack together.
Get Started
Add a Supertrend node to a new strategy in the VolatiCloud console, pair it with an ADX filter, and run a backtest against your target pair's recent history before touching hyperopt. If you're new to reading backtest output, our how-to-read-a-backtest guide covers which metrics actually matter versus which ones flatter a curve-fit result.