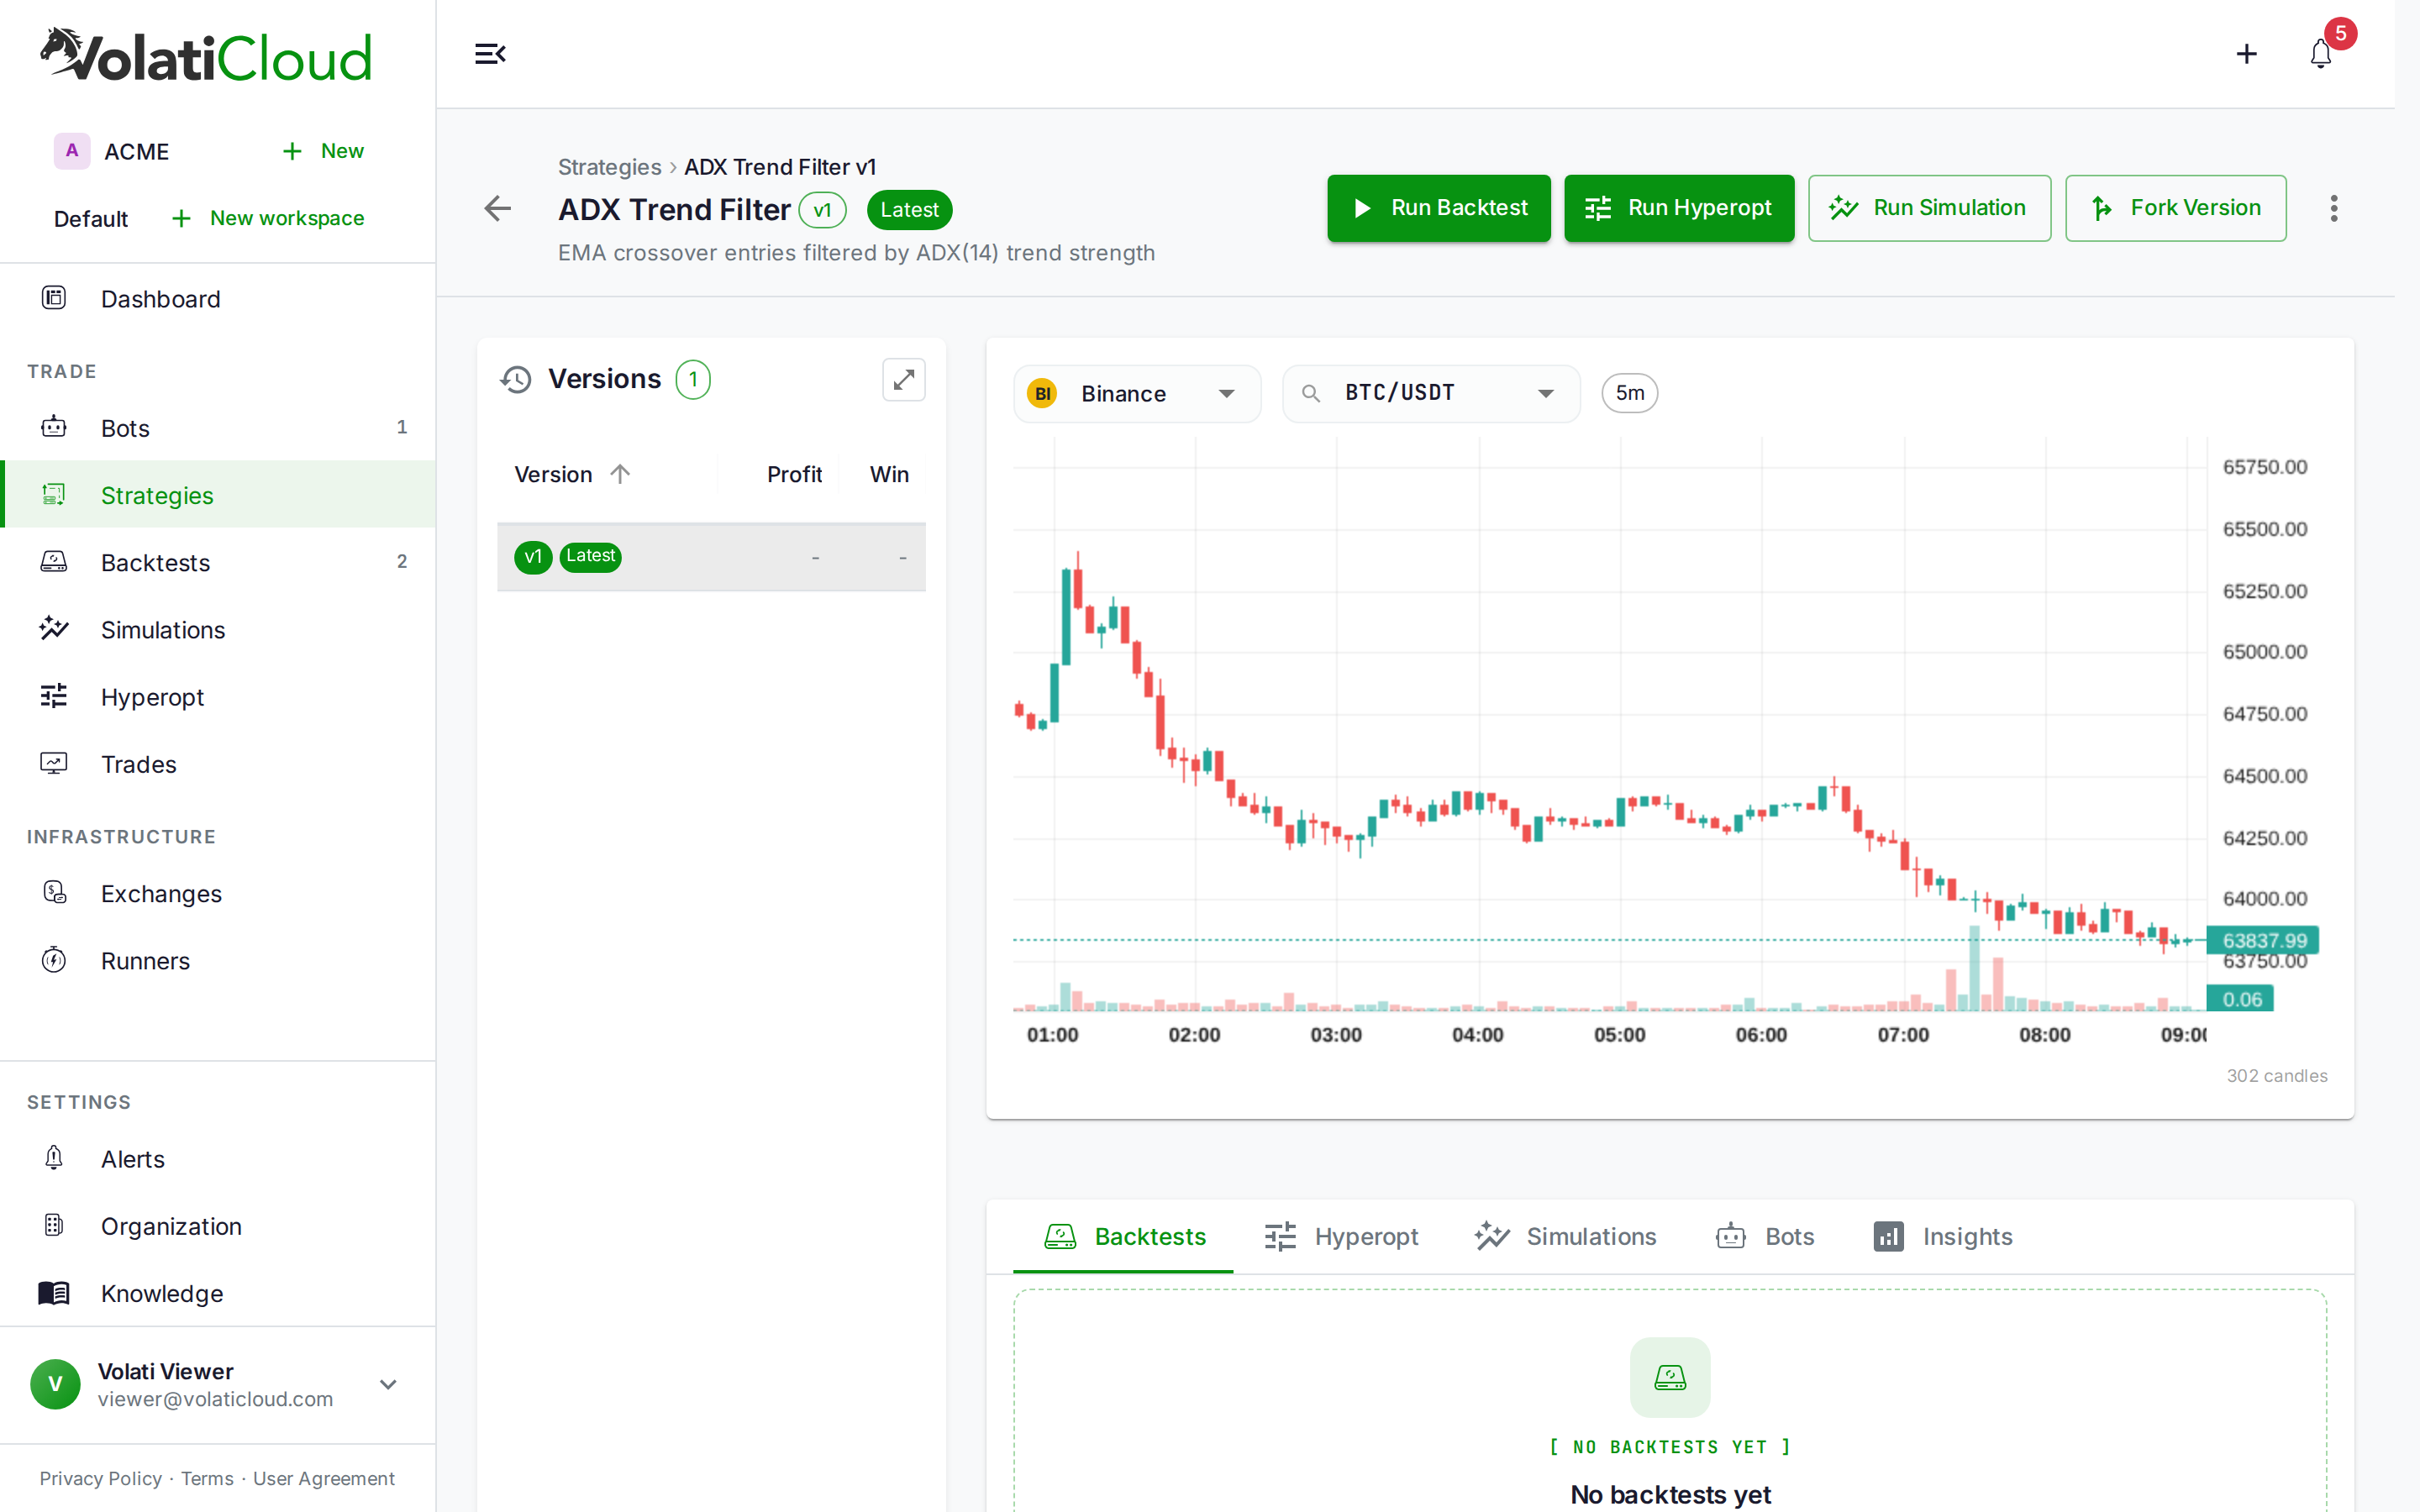
ADX Indicator Strategy: Measuring Trend Strength for Crypto Bots

Every trend-following system has the same blind spot: it can't tell a real trend from a coin flipping between two prices. An EMA crossover fires just as readily in a tight, directionless range as it does at the start of a genuine breakout — the crossover logic has no concept of "strength," only "direction." The Average Directional Index (ADX) exists to fill that gap. It doesn't tell you which way price is going. It tells you how hard to trust whatever signal already told you that.
What ADX Actually Measures
ADX comes from J. Welles Wilder's 1978 Directional Movement System — the same body of work that gave us RSI and ATR. It's built in three layers:
- Directional Movement — for each candle, compare today's high/low to yesterday's.
+DMcaptures upward movement,-DMcaptures downward movement. Only the larger of the two counts, and only if it exceeds the other by a meaningful margin. - Directional Indicators (
+DI/-DI) —+DMand-DMare smoothed over a lookback period (14 by default) and normalized against Average True Range, producing two oscillating lines that show how much of recent movement was up versus down. - ADX — the absolute difference between
+DIand-DI, expressed as a percentage of their sum, then smoothed again. That final smoothing is what turns a noisy directional spread into the steady, slow-moving ADX line you see plotted on a chart.
The critical detail is step 3: ADX is built from the difference between +DI and -DI, not their raw values. A market grinding up steadily produces a large gap between the two DI lines — high ADX. A market chopping sideways produces two DI lines tangled around each other — low ADX, regardless of which one is currently on top. ADX literally cannot distinguish an uptrend from a downtrend, because it throws that information away by construction.
Reading the 0-100 Scale
ADX is unbounded in theory but rarely trades above 60 in practice. Wilder's original bands, still the industry default:
| ADX range | Interpretation |
|---|---|
| 0–20 | No trend — price is chopping, ranging, or consolidating |
| 20–25 | Trend possibly emerging — treat as a transition zone, not a signal |
| 25–50 | Established trend — directional signals are more reliable here |
| 50–75 | Strong trend — momentum is dominant, pullbacks tend to be shallow |
| 75–100 | Extremely strong trend — rare, often unsustainable, watch for exhaustion |
The number that matters most for strategy design is 25. It's the conventional cutoff between "don't trust directional signals" and "directional signals are probably real." Almost every ADX-filtered strategy reduces to some variant of
ADX(14) > 25gating an entry that comes from somewhere else.
Note that a rising ADX matters more than the absolute level in some systems — ADX climbing from 15 to 22 says a trend is building even before it crosses the 25 line, while ADX falling from 40 to 28 says a strong trend is losing steam even though it's technically still "trending" by the table above. If your strategy only checks the instantaneous value, it will miss both of those transitions.
Why ADX Needs a Partner
Because ADX has no directional information, it is never a standalone entry signal — it's a filter. Every practical ADX strategy pairs it with something that does have direction: a moving average crossover, a Supertrend flip, a breakout, or Wilder's own +DI/-DI crossover (where +DI crossing above -DI is the bullish trigger ADX itself doesn't provide).
This is the same principle covered in our Supertrend strategy guide, where ADX above 20–25 filters out the whipsaw flips that happen when Supertrend's stop-and-reverse logic fires inside a directionless chop. The pattern generalizes: trend direction from one indicator, trend strength from ADX.
Building an ADX-Filtered Strategy in VolatiCloud
1. Add the ADX node
Open the Strategy Builder, search the indicator library for "ADX", and drag Average Directional Index onto the canvas. It lives in the trend category, described in the library as measuring "trend strength regardless of direction" — a good reminder of exactly the limitation covered above.
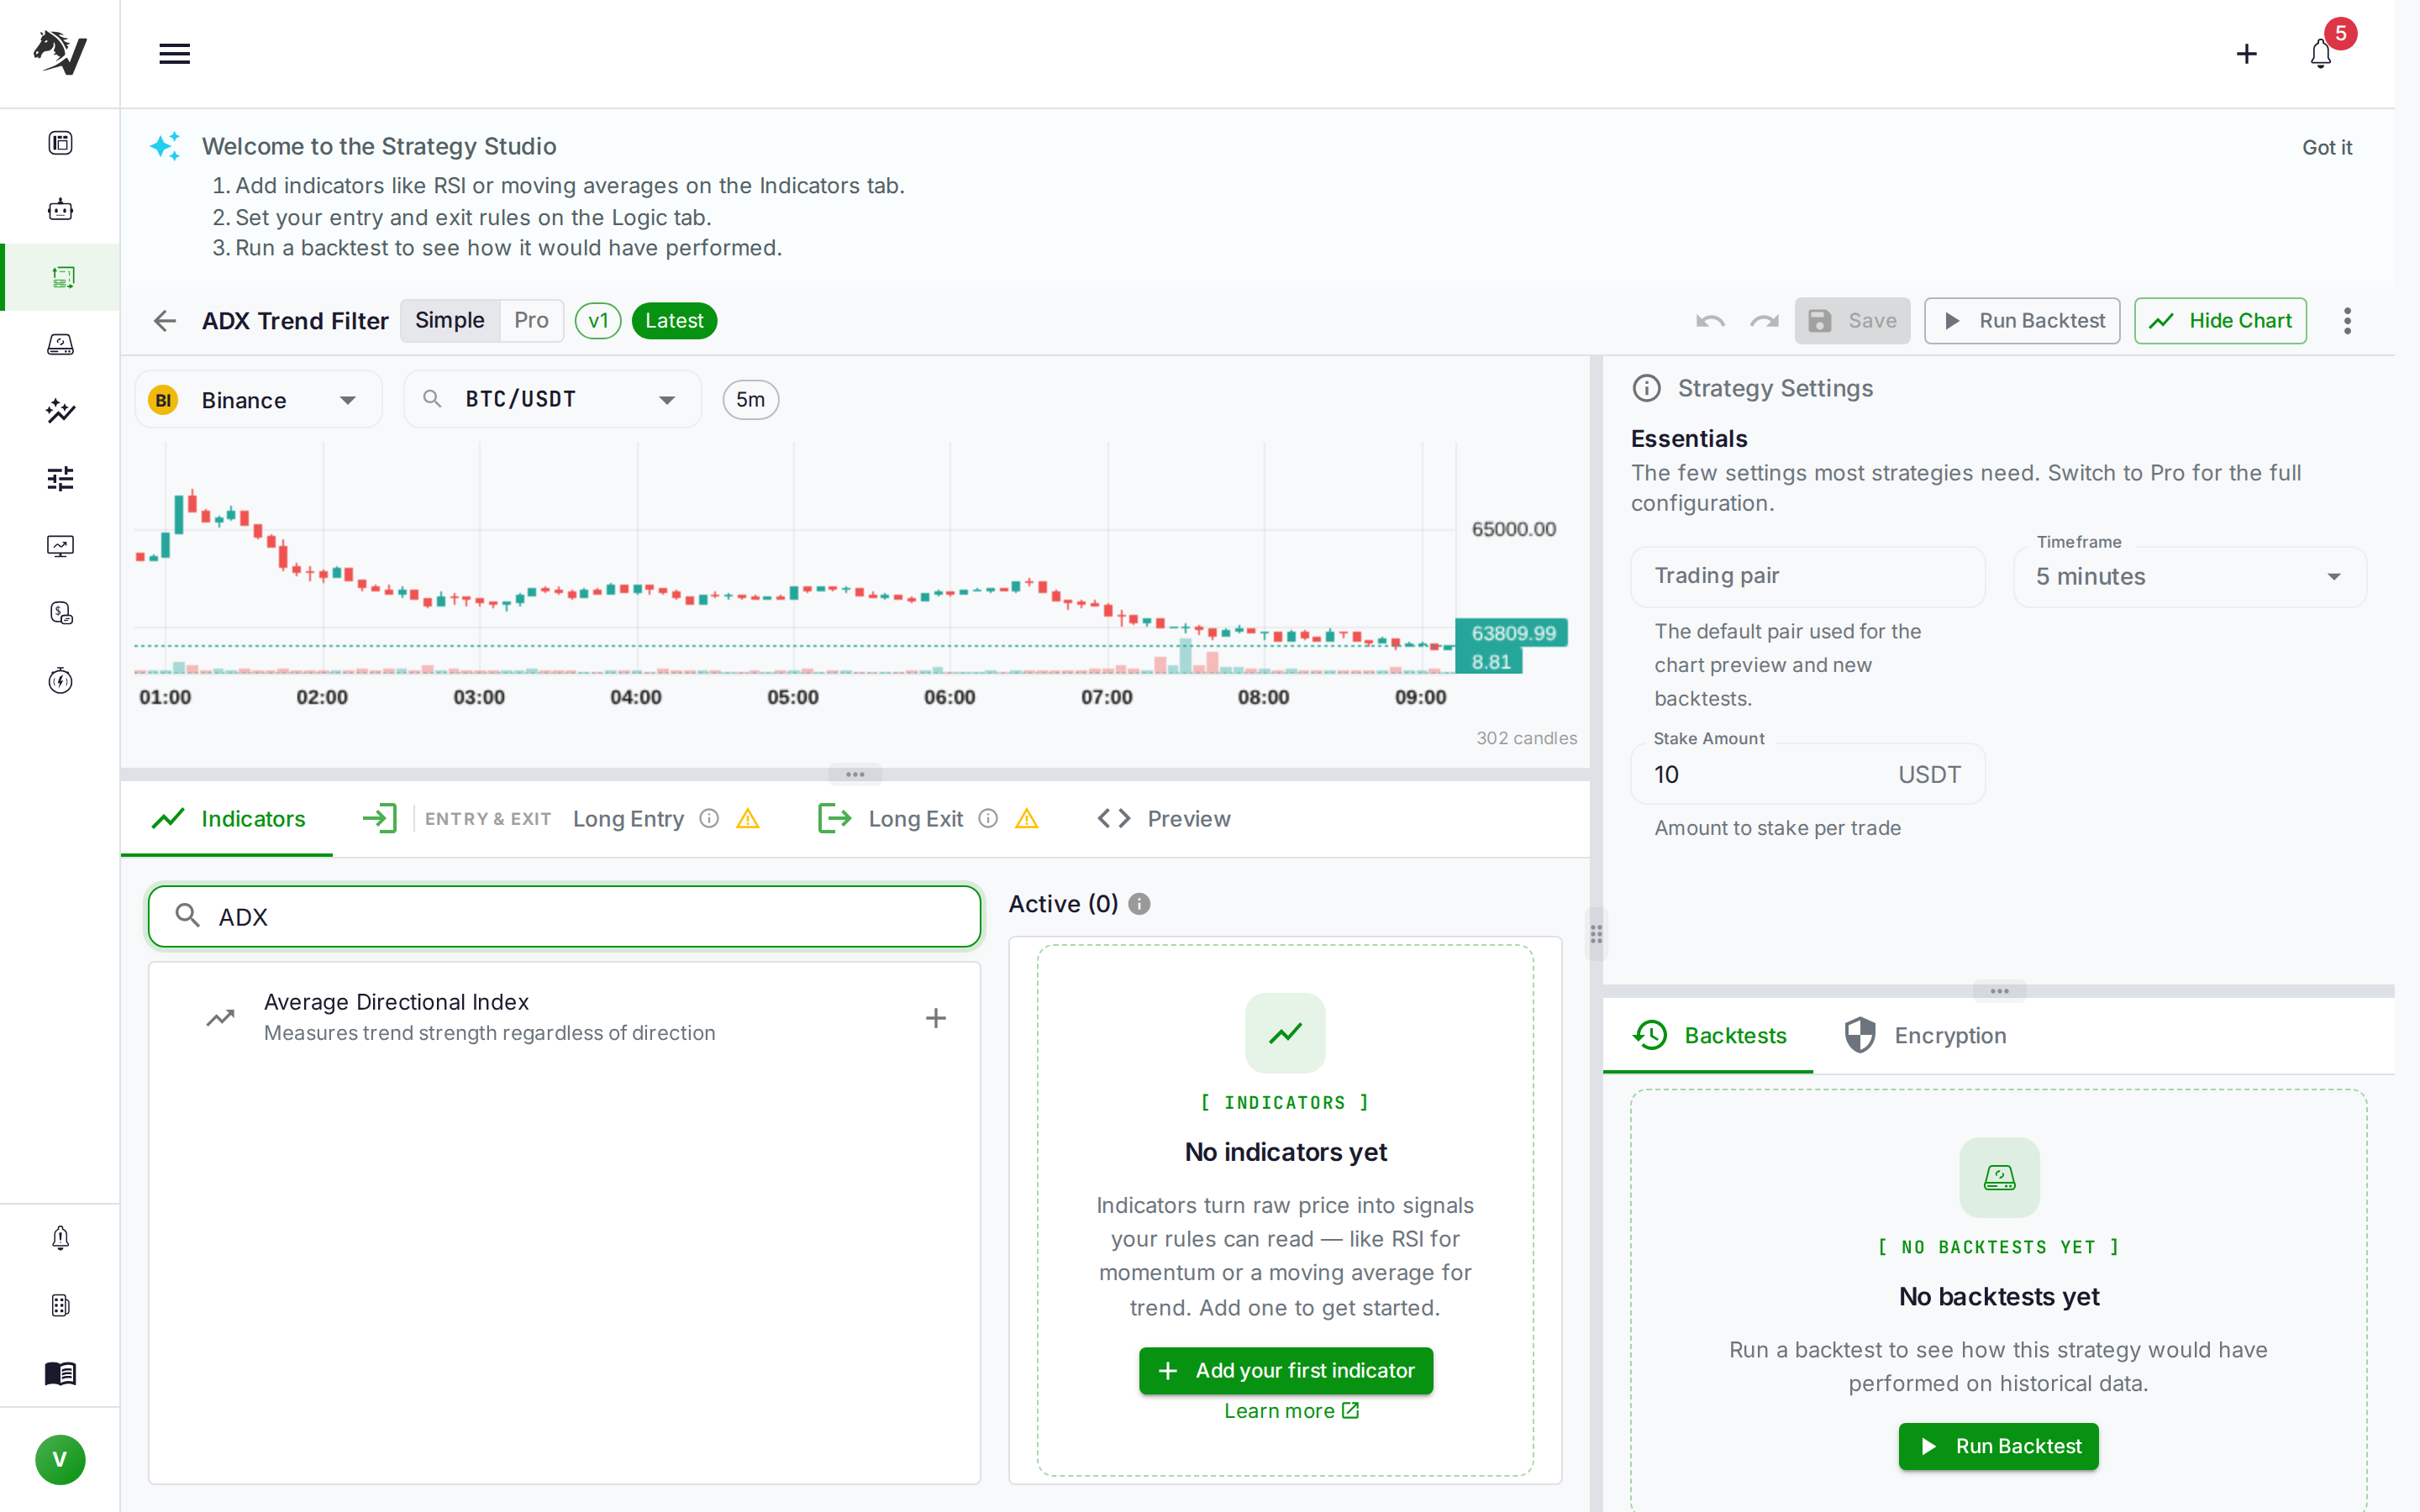
The only real parameter is period (default 14, Wilder's original value). Shorter periods react faster but whipsaw more on the "is this a trend" question itself; longer periods are steadier but slower to confirm a trend has actually started.
2. Pick a directional signal
ADX doesn't fire trades by itself, so pair it with a directional entry. A 12/26 EMA crossover is the simplest option — see our EMA crossover guide for the full setup — and combining it with ADX looks like this in the Logic tab's condition tree:
Long Entry: CROSSOVER(ema_fast, ema_slow, direction=above) AND ADX(14) > 25
The AND condition is the entire strategy: take the crossover signal only when ADX confirms the market has enough directional strength for a moving-average signal to mean something. Without the filter, the same crossover rule fires constantly inside a ranging market and loses money to fees on trades that were never going to run.
3. Consider +DI/-DI as the direction source instead
If you'd rather not add a second indicator for direction, Wilder's own +DI/-DI crossover can serve as both the trigger and the confirmation, since both lines come from the same Directional Movement calculation as ADX:
Long Entry:  CROSSOVER(plus_di, minus_di, direction=above) AND ADX(14) > 20
Short Entry: CROSSOVER(minus_di, plus_di, direction=above) AND ADX(14) > 20
This keeps the whole entry rule inside one indicator family rather than mixing ADX with an unrelated moving average — useful if you want the strategy's logic to stay conceptually simple, at the cost of +DI/-DI crosses being a noisier trigger than a moving-average crossover on most timeframes.
4. Use ADX as a negative filter for mean-reversion strategies
The same property that makes ADX useful for trend-following makes it useful, inverted, for mean reversion. RSI mean-reversion entries assume price will snap back toward an average — an assumption that breaks down precisely when ADX is high and the market is trending hard enough to keep making new extremes. Gating RSI entries with ADX(14) < 20 keeps the strategy out of exactly the conditions where mean reversion fails worst:
Long Entry: RSI(14) < 30 AND ADX(14) < 20
This is the same regime-awareness idea covered in our market regime detection guide — trending and ranging markets call for opposite strategies, and ADX is one of the more direct ways to tell them apart.
The inversion goes further than mean reversion. A grid trading bot is built to profit from price oscillating inside a band — exactly the condition low ADX describes — so some VolatiCloud users run the filter in reverse on grids, pausing or tightening the grid when ADX crosses above 25 and a real trend is more likely to break through its bounds.
What Changes When You Add an ADX Filter
Adding an ADX gate to an existing trend strategy trades trade frequency for trade quality. What to expect:
| Metric | Typical effect of adding ADX > 25 |
|---|---|
| Trade count | Drops — often 30–50% fewer entries, since chop-zone crosses get rejected |
| Win rate | Usually improves — surviving trades occur in confirmed trends |
| Average win size | Tends to increase — trend trades that pass the filter run further |
| Whipsaw losses | Drops sharply — this is the filter's primary job |
| Missed early entries | Increases — ADX confirms after a trend has started building, so you give up some of the earliest, most profitable part of a fresh move |
That last row is the real tradeoff. A pure EMA crossover catches the trend earlier and less reliably; an ADX-filtered version catches it later and more reliably. Which nets more equity depends entirely on how much of your edge comes from early entries versus how much of your drawdown comes from whipsaws — and that is a backtest question, not a theory question. Read statistical significance in backtest sample sizes before drawing a conclusion from a handful of trades.
Because ADX rejects trades rather than generating them, a fair comparison needs the same date range, same pair, same trigger indicator, with and without the filter — otherwise you are measuring a different market period, not the filter.
ADX vs. Other Regime Filters
ADX is one of several ways to answer "should I even be trading right now," and it helps to know where it sits relative to the alternatives:
| Approach | Signal basis | Best for |
|---|---|---|
| ADX threshold | Smoothed directional-movement divergence | General-purpose trend/range classification, works on any trigger indicator |
| Supertrend flip frequency | How often the ATR band has flipped recently | Detecting chop specifically in Supertrend-based systems |
| Bollinger Band width | Volatility contraction/expansion | Spotting the calm-before-breakout squeeze, not trend strength itself |
| Full regime detection | Multi-factor classification (trend / range / volatile) | Switching between entirely different strategies per regime |
If you already run a market regime detection layer, ADX is very likely one of the inputs feeding that classifier — this post is a deep dive on one of its building blocks, not a competing approach.
Three Mistakes That Undo an ADX Filter
Requiring ADX to rise before entering, then exiting when it falls below the same line. ADX is a lagging, heavily smoothed indicator — by the time it confirms a trend, a meaningful chunk of the move is already priced in. Using the identical threshold for both entry and exit means the strategy tends to enter late and exit late on the same signal, giving back the edge the filter was supposed to add. Most working systems use ADX only as an entry gate and manage exits with something faster — a trailing ATR stop, a Supertrend flip, or a fixed take-profit.
Treating 25 as universal across timeframes and pairs. A daily-chart ADX of 25 and a 5-minute-chart ADX of 25 do not represent comparable trend strength — lower timeframes churn through more noise per candle, so the same numeric threshold filters differently depending on what timeframe and pair it's applied to. Re-tune the threshold per timeframe rather than copying a value from a blog post (including this one) directly into a live strategy.
Stacking ADX with a second trend-strength filter instead of a directional one. ADX combined with, say, Bollinger Band width is two measurements of the same underlying property — how much price is moving, not where. That redundancy narrows the strategy's opportunity set without meaningfully improving signal quality. ADX earns its place paired with something that answers a different question: which way, not how much.
Backtesting the Threshold, Not Just the Strategy
The 25 cutoff is a convention, not a law of markets — it was chosen by Wilder for the instruments and timeframes he traded in the 1970s, not derived from crypto's 24/7, high-volatility order flow. Treat the threshold itself as a parameter to test:
| Threshold | Effect |
|---|---|
| Lower (e.g. 15–18) | More trades pass the filter, including some marginal trends — higher trade count, lower average trade quality |
| Wilder default (20–25) | Balanced — the conventional starting point for most timeframes |
| Higher (e.g. 30–35) | Fewer, higher-conviction trades — but the strategy sits out longer, and by the time ADX confirms a strong trend a meaningful part of the move may already be over |
Run hyperopt across both the ADX period and the threshold value together, since they interact — a longer period smooths the line enough that a lower threshold behaves similarly to a shorter period with a higher one. As always, validate the winning combination on an out-of-sample date range; a threshold that happened to fit one trending quarter is not the same as a threshold that holds up across a full market cycle. Our guide to reading backtest output covers which metrics actually separate a real edge from a curve-fit one.
Get Started
Add an ADX node to a strategy in the VolatiCloud console, pair it with a directional signal like an EMA crossover or +DI/-DI cross, and backtest the 20–25 threshold range against your target pair before touching hyperopt. If you already run a trend-following bot without a strength filter, adding ADX(14) > 25 to the existing entry condition is one of the smallest changes with the largest effect on how often you get whipsawed in chop.