Resource Usage Metering: What Your Crypto Bots Cost You

You started a bot on a Docker runner three weeks ago, forgot about it, and now your credit balance is lower than expected. Was it CPU? Was it the OHLCV cache filling up disk? Was it just running longer than you thought? A flat "$0.08/hour" line item can't answer that — you need to see what the container actually consumed.
Flat-rate billing hides the wrong number
Most SaaS trading platforms price bots at a flat rate per bot per hour, regardless of what that bot is actually doing. That's simple to bill, but it's unfair in both directions: a Dry Run bot idling at 5% CPU on one pair pays the same as a Pro strategy scanning 40 pairs with a stacked indicator chain, and a lean single-pair scalper subsidizes everyone else's heavier workloads.
VolatiCloud instead meters actual resource consumption — CPU, memory, network, and storage — per bot, backtest, and hyperopt run, and turns that into a credit deduction that reflects what really happened on the runner. The trade-off is that "what am I paying for" becomes a real question with a real answer, instead of a fixed number you have to take on faith.
What actually gets measured
Four resources are sampled continuously while a workload runs:
| Resource | Unit | What drives it up |
|---|---|---|
| CPU | core-hours | Indicator-heavy strategies, more monitored pairs, tight polling loops |
| Memory | GB-hours | Large OHLCV history windows, many concurrent pairs, in-memory caching |
| Network | bytes transferred | Fetching candles, placing orders, exchange API polling frequency |
| Storage | bytes read/written | The bot's SQLite trade database and its historical OHLCV cache |
A stopped bot samples nothing and costs nothing — the meter only runs while a container is actually up. That's the same principle covered in more depth in How Exchange Fees Silently Kill Your Crypto Bot's P&L: the fee or cost you don't see is the one that erodes returns fastest, and the fix is always the same — make it visible.
Not every runner meters usage
Metering happens per runner, and it's opt-in at the runner level — a runner only samples and bills resource consumption if billing is enabled on it. If you've connected your own Docker host or Kubernetes cluster and haven't enabled billing on that runner, the bots running there won't show up as credit deductions at all — you're paying for that infrastructure directly to whoever hosts it, not to VolatiCloud. The Usage page's own empty state says this plainly: "Usage tracking starts when you run bots or backtests on runners with billing enabled."
This matters when you're debugging why the dashboard shows less activity than you expect. A quiet Usage page doesn't necessarily mean your bots aren't running — it can mean they're running on infrastructure that isn't wired into the metering pipeline at all. Check the runner's billing configuration before assuming a bot is idle.
Where to see it: the Usage page
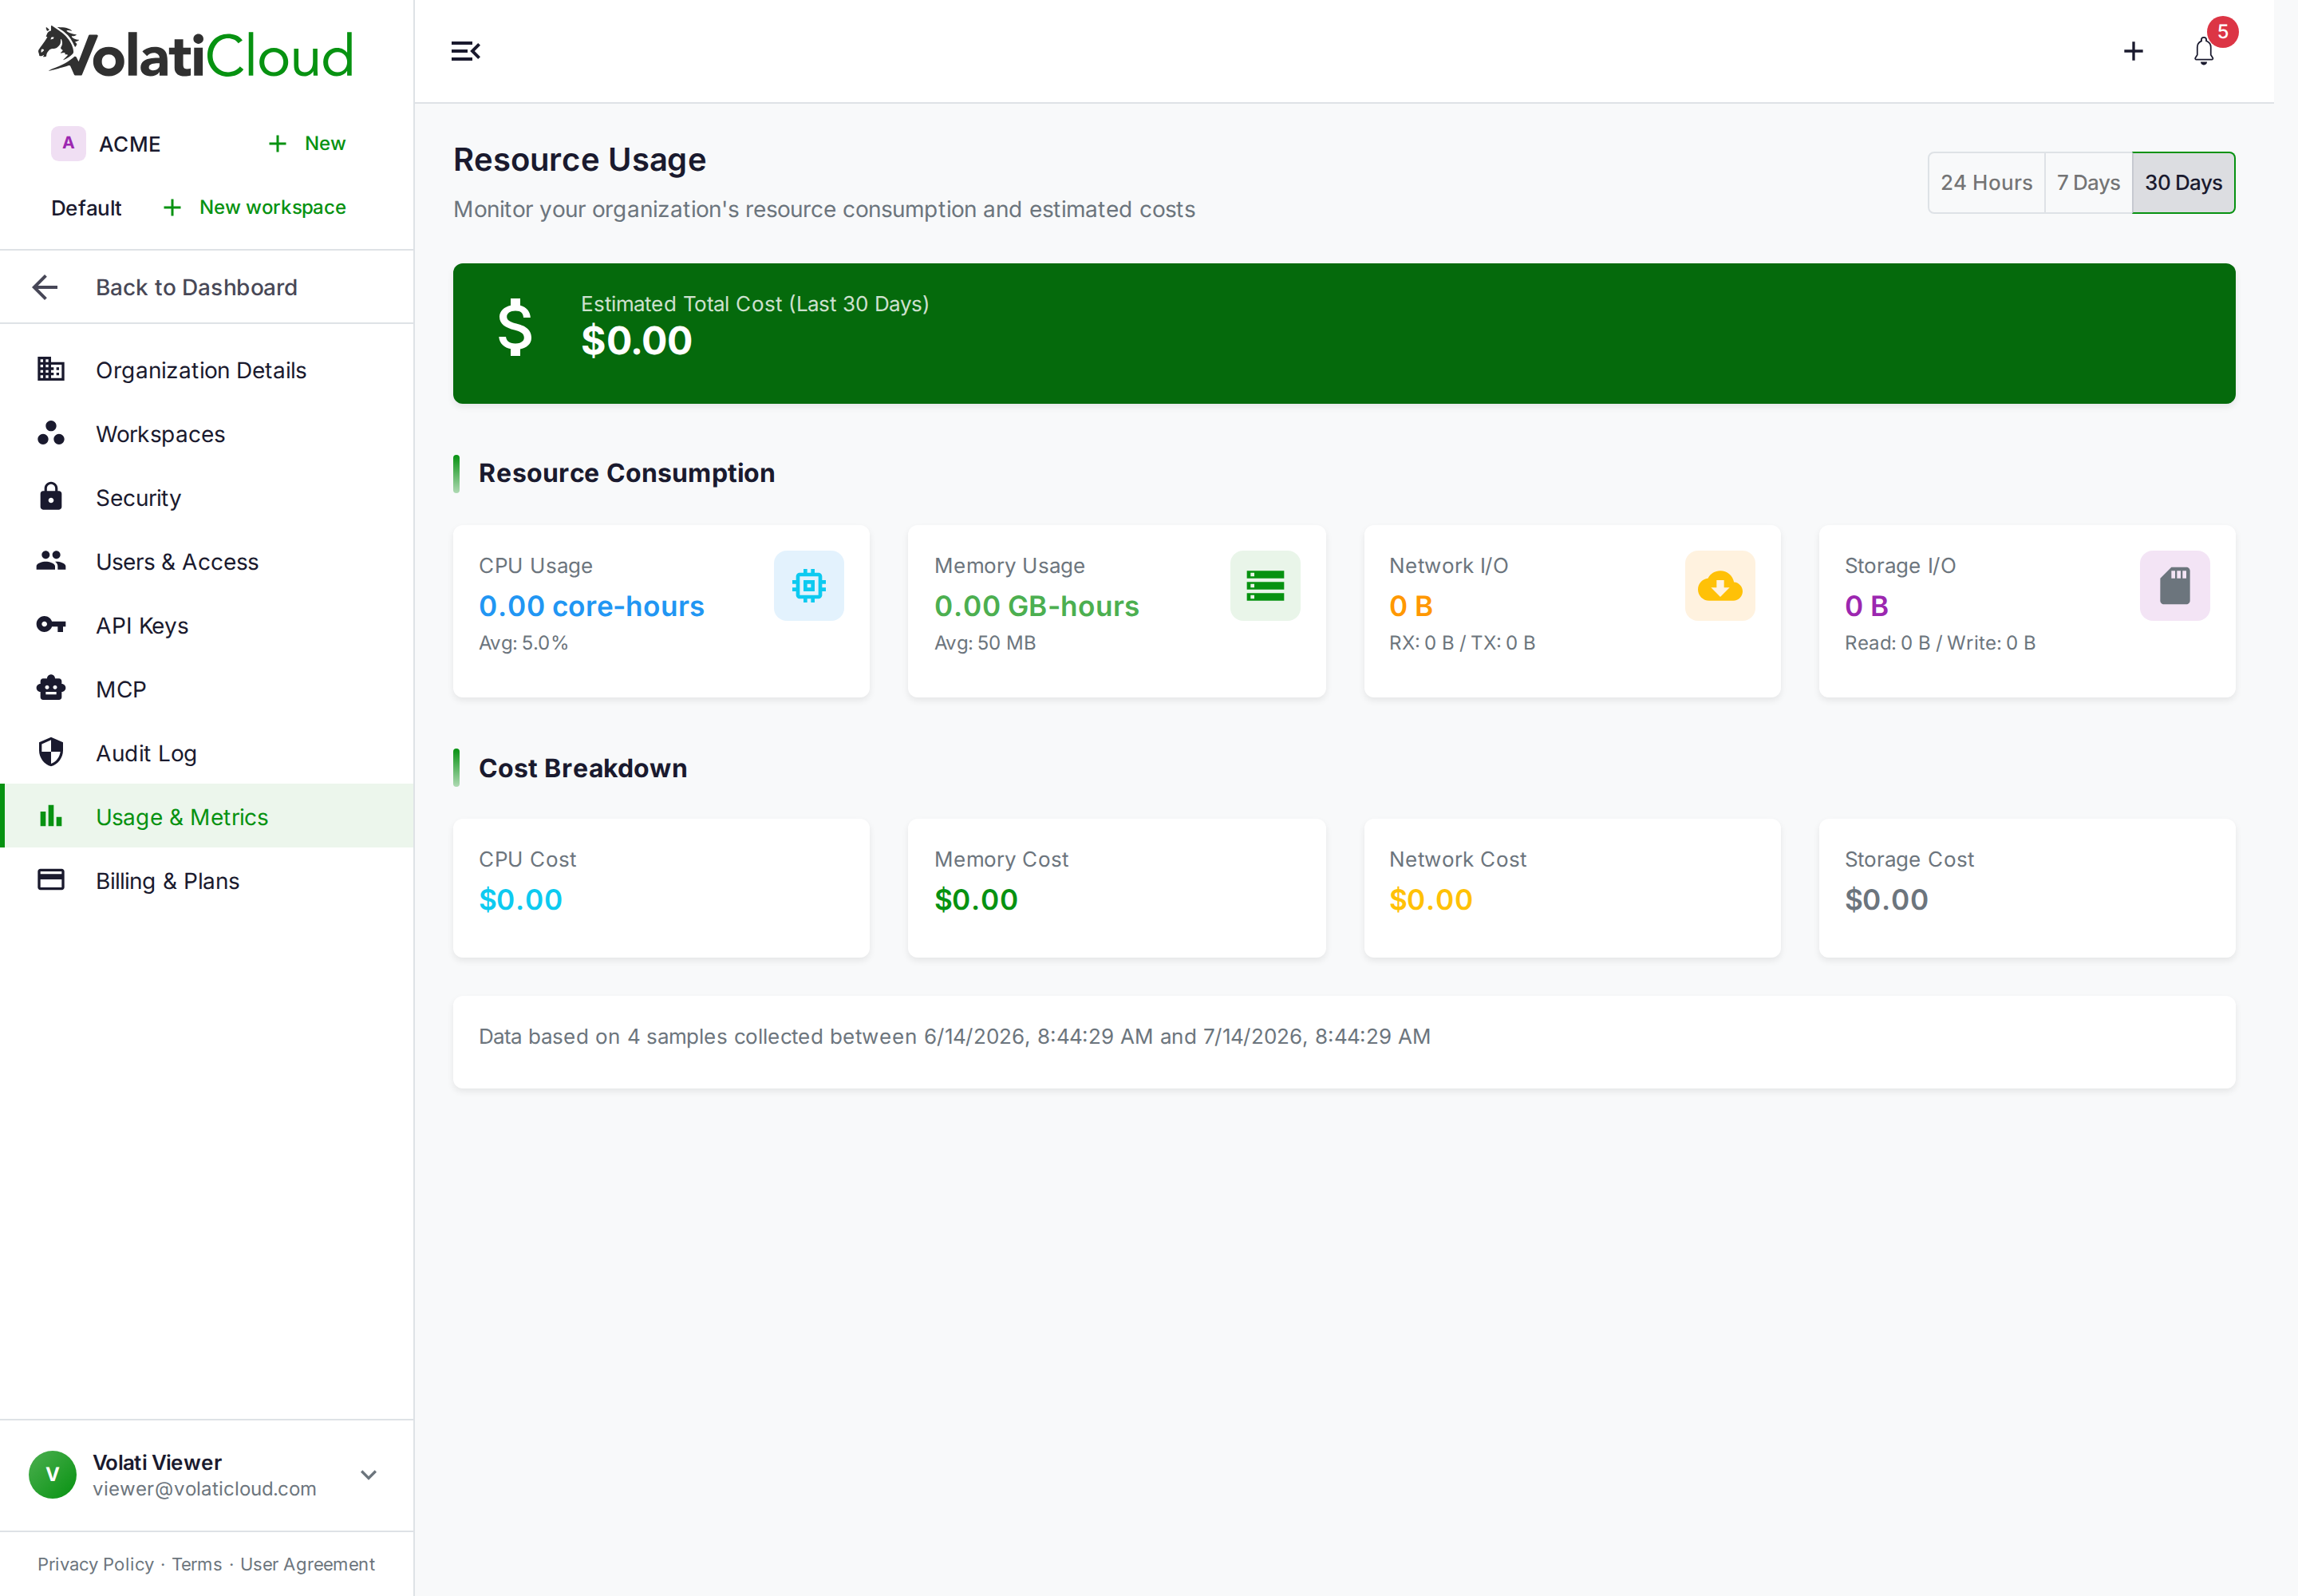
Organization → Usage & Metrics rolls all of that sampling up into one dashboard. Three pieces matter:
Estimated Total Cost sits at the top as a single number for the selected window — 24 hours, 7 days, or 30 days. It's a live estimate, not a final invoice line, but it moves as your bots run, which makes it useful for catching a runaway workload before it drains your balance.
Resource Consumption breaks that estimate into the four inputs — CPU core-hours with average and max utilization, memory GB-hours with average and peak footprint, total network I/O split into RX/TX, and total storage I/O split into read/write. Each card's tooltip carries the max value alongside the average, which is often the more useful number: a strategy that averages 8% CPU but spikes to 95% on every candle close is a different risk profile than one that sits at a flat 8%.
Cost Breakdown turns each of those four numbers into its own dollar figure — CPU cost, memory cost, network cost, storage cost — so you can see which resource is actually driving the bill instead of guessing. A bot that's expensive because of network egress (too many pairs, too-frequent polling) needs a different fix than one that's expensive because of CPU (simplify the indicator stack, reduce timeframe granularity).
At the bottom, a sample-count line (Data based on N samples collected between X and Y) tells you how much data backs the numbers above it — useful context before you make a decision off a window with very few samples.
From samples to credits
The Usage page and your credit balance are two views of the same pipeline. Samples are collected roughly every minute, rolled up into hourly and daily aggregates, and converted to a cost using your runner's rate card — then deducted from your balance on the same hourly cadence described in VolatiCloud Plans Explained. If a number on the Usage page and a usage_deduction line in your Transaction History look out of sync by a few minutes, that's the aggregation catching up — the ledger is always the authoritative source for what was actually charged.
Switch the time range to 30 Days before making a cost-cutting decision. A single noisy hour on the 24-hour view can look alarming; the same hour barely moves the 30-day average.
What actually moves the needle
A few concrete levers, roughly in order of impact:
- Stop bots you're not actively trading. A stopped bot samples zero of every resource. If you're testing a strategy in Dry Run and not watching it, pausing it between sessions costs nothing and loses nothing — positions aren't force-closed, they're just left alone on the exchange.
- Match runner size to workload. A Docker runner sized for one lightweight bot doesn't need the same headroom as a Kubernetes cluster running 40. Over-provisioned containers show up as elevated memory GB-hours even when the strategy itself is cheap.
- Trim the pair list. Every additional monitored pair adds its own CPU cycle, its own OHLCV cache footprint, and its own network fetch on every candle. A 40-pair scanner and a 5-pair scanner running the same strategy logic are not close in cost.
- Simplify the indicator stack. Every indicator recalculates on every candle for every monitored pair. A strategy with six indicators across three timeframes multiplies that work six times three times pair-count, every single candle close.
- Watch the storage line if you're running long backtests. Historical OHLCV caches and full-resolution SQLite trade logs both accumulate under storage I/O — worth checking before assuming a cost spike is CPU-related.
Why this belongs to you, not to guesswork
The alternative to a metering pipeline is trusting a vendor's flat-rate math or trusting your own mental model of what a bot "should" cost — both of which fail the moment your strategy or runner setup changes. Because VolatiCloud samples real container metrics rather than estimating from bot count, the Usage page reflects what actually happened, not what a pricing tier assumes happened. That's the same transparency principle behind the credit ledger itself: every number on the dashboard should be traceable back to something real, not a black box you have to trust.
Common questions
Why does the 24-hour view sometimes show $0.00 even though a bot is running? Samples are collected roughly once a minute and rolled up on an hourly cadence. A bot that just started, or one running on a runner without billing enabled, can legitimately show zero — check the sample count line at the bottom of the page before assuming something's broken.
Does a Dry Run bot cost the same as a live bot? Yes, on the compute side. Metering measures container resource consumption, not whether trades touch a real exchange balance. A Dry Run bot with the same pair list and indicator stack as a live bot draws roughly the same CPU, memory, and network.
Can I see cost per individual bot? The Usage page currently rolls up consumption at the organization level across all billing-enabled runners, not broken out per bot. If you're running several bots and need to isolate which one is expensive, the fastest way is to stop one at a time and watch how the 24-hour numbers shift — a stopped bot samples nothing, so removing it isolates the rest.
Does a stopped bot with open positions still cost credits? No. Stopping a bot halts metering immediately; any open exchange positions stay exactly where they were, untouched, until you restart the bot.
Check your own usage
Open Organization → Usage & Metrics in the VolatiCloud console and switch between the 24-hour, 7-day, and 30-day views. If a number surprises you, the Cost Breakdown section will tell you which resource to chase first — and the Billing Overview covers exactly how that number turns into a credit deduction.